Against That Poverty And Infant EEGs Study
A recent paper claims to have found an Impact Of A Poverty Reduction Intervention On Infant Brain Activity. It’s doing the rounds of the usual media sites, like Vox _and the _New York Times :
 The New York Times @nytimesBreaking News: Cash payments for low-income mothers increased brain function in babies, a study found, with potential implications for U.S. safety net policy.
  nyti.msCash Aid to Poor Mothers Increases Brain Activity in Babies, Study FindsThe research could have policy implications as President Biden pushes to revive his proposal to expand the child tax credit.[8:15 PM ∙ Jan 24, 2022
13,165Likes3,348Retweets](https://twitter.com/nytimes/status/1485707740282511360)
I was going to try to fact-check this, but a bunch of other people (see eg Philippe Lemoine, Stuart Ritchie) have beaten me to it. Still, right now all the fact-checking is scattered across a bunch of Twitter accounts, so I’ll content myself with being the first person to summarize it all in a Substack post, and beg you to believe I would have come up with the same objections eventually.
Before we start: why be suspicious of this paper? Hundreds of studies come out daily, we don’t have enough time to nitpick all of them. Why this one? For me, it’s because it’s a shared environmental effect being measured by EEG at the intersection of poverty and cognition.
Shared environmental effects on cognition are notoriously hard to find. Twin studies suggest they are rare. Some people have countered that perhaps the twin studies haven’t measured poor enough people, and there’s a lot of research being done to see what happens if you try to correct for that, but so far it’s still controversial.
All that research is being done by cognitive testing, which is a reasonable way to measure cognition. This study uses EEG instead. I’m skeptical of social science studies that use neuroimaging, and although EEG isn’t exactly the same as neuroimaging like CT or MRI, it shares a similar issue: you have to figure out how to convert a multi-dimensional result (in this case, a squiggly line on a piece of paper) into a single number that you can do statistics to. This offers a lot of degrees of freedom, which researchers don’t always use responsibly.
People love studies showing that some effect is visible on MRI, or EEG, or some other three letter acronym. It makes it feel real - you can literally see the effects! In the physical brain! I think this temptation should be resisted. Effects that you can literally see in the physical brain are much rarer than effects that you can detect by asking people stuff, but it’s really easy to get artifacts and smudges that you hallucinate into signal.
 Stuart Ritchie @StuartJRitchieI’ve been wary of EEG research in young kids ever since I read this detailed post by @annemscheel, which looks at a different kind of EEG measure but highlights the very very many ways that noise and unreliability can be introduced into the analysis:
  the100.ciCumulative noise: A mini review of four ERP studies on infants’ perception of biological motion[Disclaimer: I am not an EEG expert. I probably got some things wrong. Please let me know about them.] TL;DR: I reviewed four infant ERP studies on the same topic and found that their results are maximally incongruent with each other. Yet the analytical choices made in the papers differ too much[10:00 PM ∙ Jan 25, 2022
114Likes2Retweets](https://twitter.com/StuartJRitchie/status/1486096613210734595)
And finally, people want to discover a link between poverty and cognitive function so bad. Every few months, another study demonstrates that poverty decreases cognitive function, it’s front page news everywhere, and then it turns out to be flawed. This recent analysis tried to replicate twenty poverty/cognition priming studies. 18/20 replications had lower effect sizes than in the original, and 16/20 had effect sizes statistically indistinguishable from zero. Most of these studies were vastly worse than the current paper - they were trying to do dumb things with priming as opposed to this much smarter thing with actual RCTs of childhood environment. Still, this whole field makes me nervous.
None of these things should make us dismiss the study. There’s a thin line between a heuristic and a bias. We need some heuristics to figure out which studies to investigate further. But if we grip them too tightly, they become biases, where we doubt any study that doesn’t correspond to our pre-existing beliefs and political commitments. I’m just saying that this study has enough yellow flags that it’s worth checking out in more depth to see if anything’s wrong with it.
(also, the lead author is named Dr. Troller, and I am a nominative determinist)
Getting to the paper itself: it’s called The Impact Of A Poverty Reduction Intervention On Infant Brain Activity. It’s part of a much larger study called Baby’s First Years which randomizes some low-income mothers to receive $300/month in extra support. Most of these families were making about $20,000, so this was an increase of about 10-20%.
Some past research had shown disadvantaged children had more low-frequency brain waves than other kids, so they decided to test whether they could find this same effect here. They EEGd 435 one-year-old children who had/hadn’t received the extra money. Results: differences in the the level of beta waves (effect size = 0.23, p = 0.02) and gamma waves (effect size = 0.22, p = 0.04) on the EEG, though no significant difference in alpha or theta waves. They conclude that financial support changes brainwave activity; under the circumstances, it seems reasonable to conclude that this represents some kind of healthier neurodevelopment.
How robust is this finding?
All differences lost statistical significance after adjustment for multiple comparisons. What does that mean? Well, remember that XKCD comic with the jellybeans:
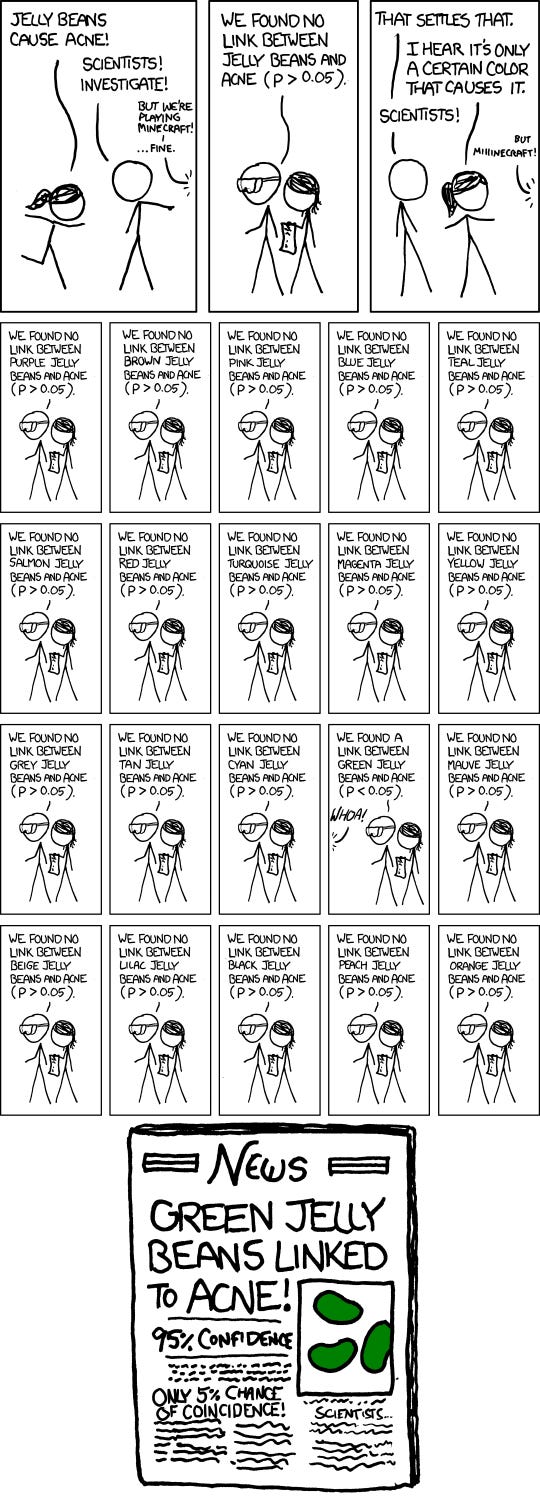
That’s multiple comparisons. If you test 20 different things and get one positive result, that doesn’t mean there’s a real effect, it means you kept doing tests until one of them randomly came out positive because of noise.
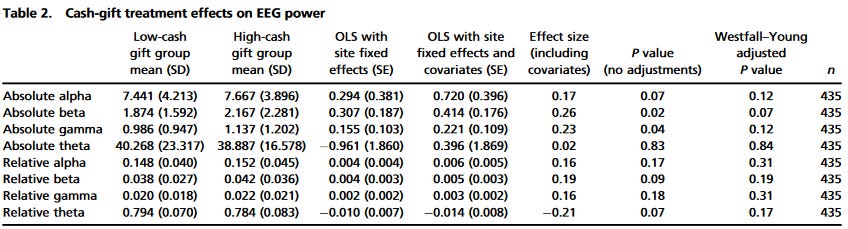
Here’s the relevant table. Think of the eight different kinds of EEG the same way you think of the twenty different jellybean colors. In order to trust their positive results, the researchers had to correct for multiple comparisons. The simplest method for this is something called Bonferroni correction, which would have forced them to get a p-value of 0.05/8 = 0.00625. But that would be really harsh; in cases like these where hypotheses are correlated (ie if poor people have different alpha waves, that makes it more likely they also have different beta waves) you can use a gentler method called Westfall-Young adjustment. The researchers did this here and it told them that none of their results were significant anymore, which they chose to . . . ignore? I don’t know, the abstract sure does say “infants in the high-cash gift group showed more power in high frequency bands”, which sounds like a claim of a positive result.
Maybe it’s because of this:
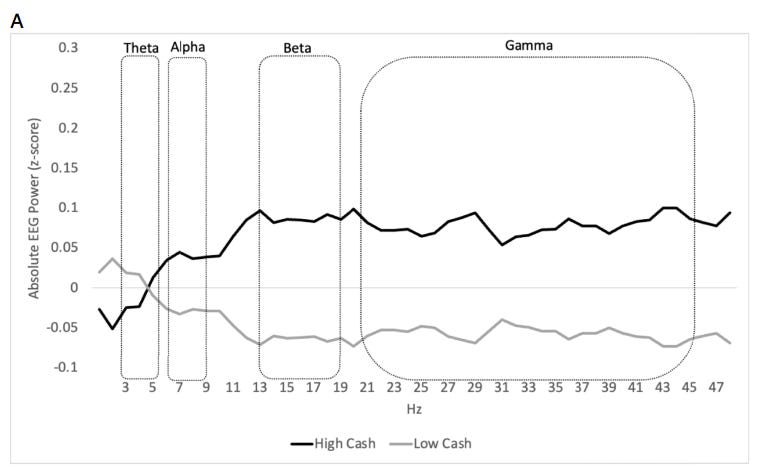
This graphs the EEG power by frequency of the two different groups. It seems like a pretty big effect in favor of the high-cash babies having stronger high-frequency (and weaker low-frequency) EEGs.
Part of the problem with brain imaging studies is you have to find some way to turn complicated multi-dimensional data into a single number you can stick a p-value on. Sometimes that’s hard and you lose some subtlety. This graph shows a pretty obvious difference between the two groups. Can we just say that regardless of the stats, we can eyeball a significant difference here?
Andrew Gelman says no. He gets the raw data and randomizes the treatment variable, ie flips a coin to decide whether kids are in an artificial Red Group or Blue Group. Then he graphs EEG frequencies by group nine times:

On inspection, the graph still looks like there are big differences between the two groups. But these can’t be real, because this time the groups were determined by coin flip - the artificial Red Group and Blue Group don’t have any overall difference in how much money they got. This is just an artifact.
Why do groups with no real difference between them look so different on the graphs? This is why I hate imaging. All of your intuitions are always wrong! In this case it seems to be a function of taking an “average” of groups that have a lot of overlap in order to form them into a straight line, but in imaging there’s always something like this.
I think this is the strongest evidence against this study: the p-value isn’t significant and the graph proves nothing. But some other people provide other important critiques:
Stuart Ritchiesays that this article was accepted to PNAS under a special deal where “US National Academy of Sciences members get an easier ride to publication”. I see different opinions about exactly what this consists of; Stuart thinks they can “hand-pick reviewers”; another researcher thinks they “do not have to go through anonymous peer review”.
Heath Henderson says that the study was preregistered to examine only alpha, theta, and gamma waves. But the strongest result (one of the ones that was significant before multiple-hypothesis adjustment) was for beta waves! Usually it’s a big red flag to have your strongest result be something you didn’t pre-register; it means you kept rooting around until you found something. Here I’m on the fence about how much to worry, because why wouldn’t you study beta waves if you were doing an EEG? But the paper was based on previous research finding differences mainly in alpha and theta waves, whereas this paper “found” “differences” in beta and gamma waves, so I guess this counts as bad.
Julia Rohrer points to this study on the effect of foster care placement in Romania. Some kids in Romania were randomly assigned to stay in (probably terrible) orphanages vs. be placed in foster care. Despite this probably being a bigger difference in adversity than getting or not getting $300/month, there was no clear difference on their EEGs. However, subgroup analysis suggested an EEG difference for the (very small) group of children who were adopted out before 1 year old, which would fit this study on one-year-olds. However , the difference was found only in relative alpha EEG, whereas this study found no difference at all in relative alpha, and its only (pre-adjustment) significant findings were in absolute beta and absolute gamma. In general, I do not get the feeling that previous studies have done a great and ironclad job establishing that EEG measures adversity or that more powerful EEG waves mean more successful children or anything like that.
Andrew Gelman finishes his article by warning us not to conclude that cash grants don’t affect kids’ EEGs. For all we know, they might and this study is just underpowered to detect it. That’s fine and I agree.
But this study basically shows no effect. We can quibble on whether it might be suggestive of effects, or whether it was merely thwarted from showing an effect by its low power, but it’s basically a typical null-result-having study. The authors should not have reported their result as an unqualified positive, and the media should have challenged their decision to do so rather than uncritically signal-boosting it.