Declining Sperm Count: Much More Than You Wanted To Know
Is Sperm Count Declining?
People say it is.
Levine et al 2017 looks at 185 studies of 42935 men between 1973 and 2011, and concludes that average sperm count declined from 99 million sperm/ml at the beginning of the period to 47 million today.
Levine et al 2022 expands the previous analysis to 223 studies and 57,168 men, including research from the developing world. It finds about the same thing.
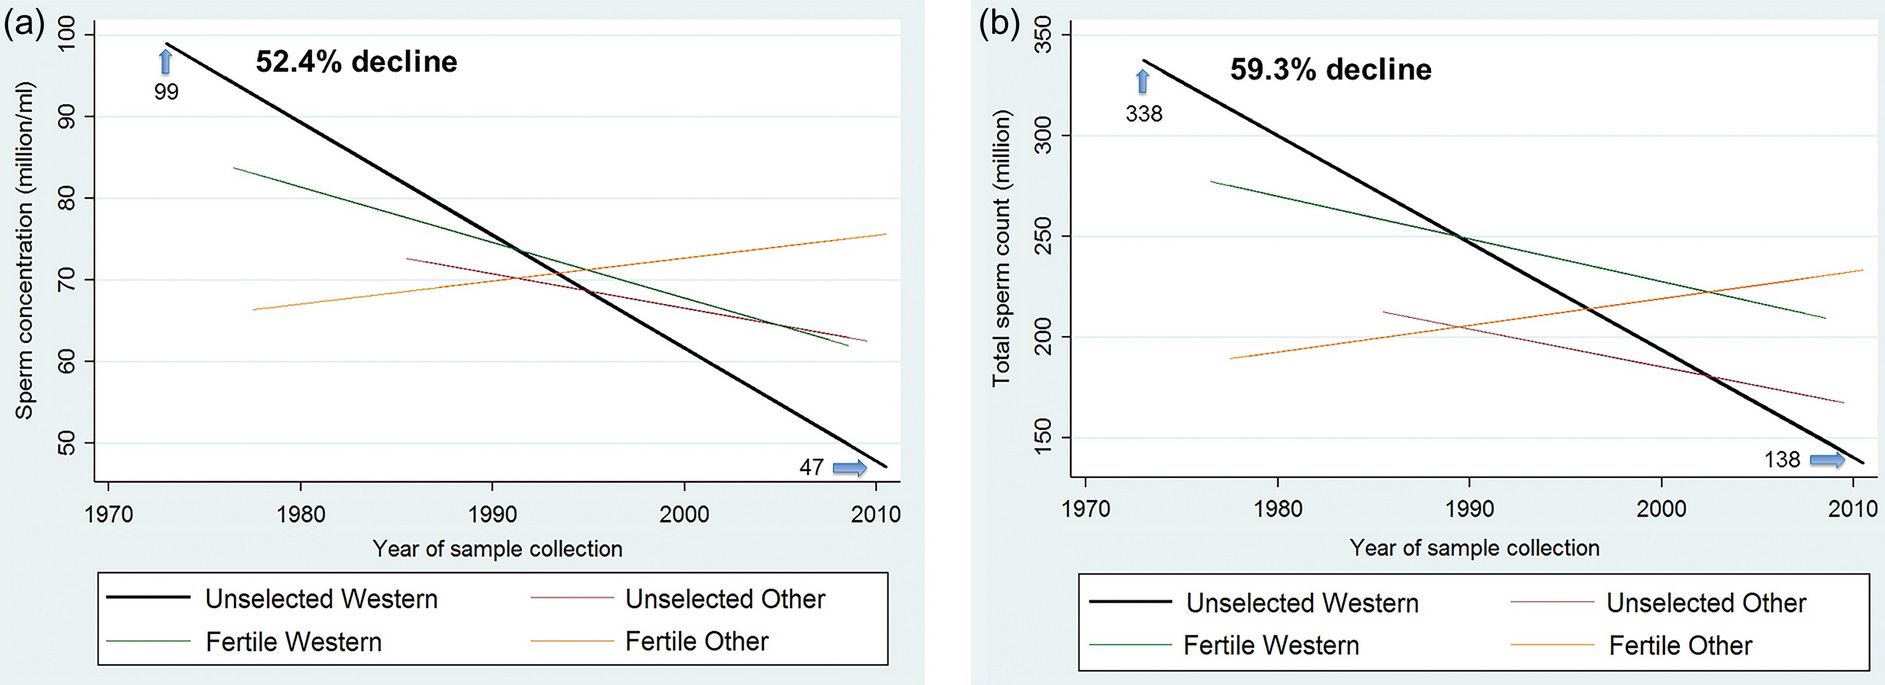 Source: Figure 3 here
The “et al” includes Dr. Shanna Swan, a professor of public health who has taken the results public in the ominously-named Count Down: How Our Modern World Is Altering Male and Female Reproductive Development, Threatening Sperm Counts, and Imperiling the Future of the Human Race.
Is Declining Sperm Count Really “Imperiling The Future Of The Human Race”?
Swan’s point is that if sperm counts get too low, presumably it will be hard to have babies (though IVF should still work).
How long do we have?
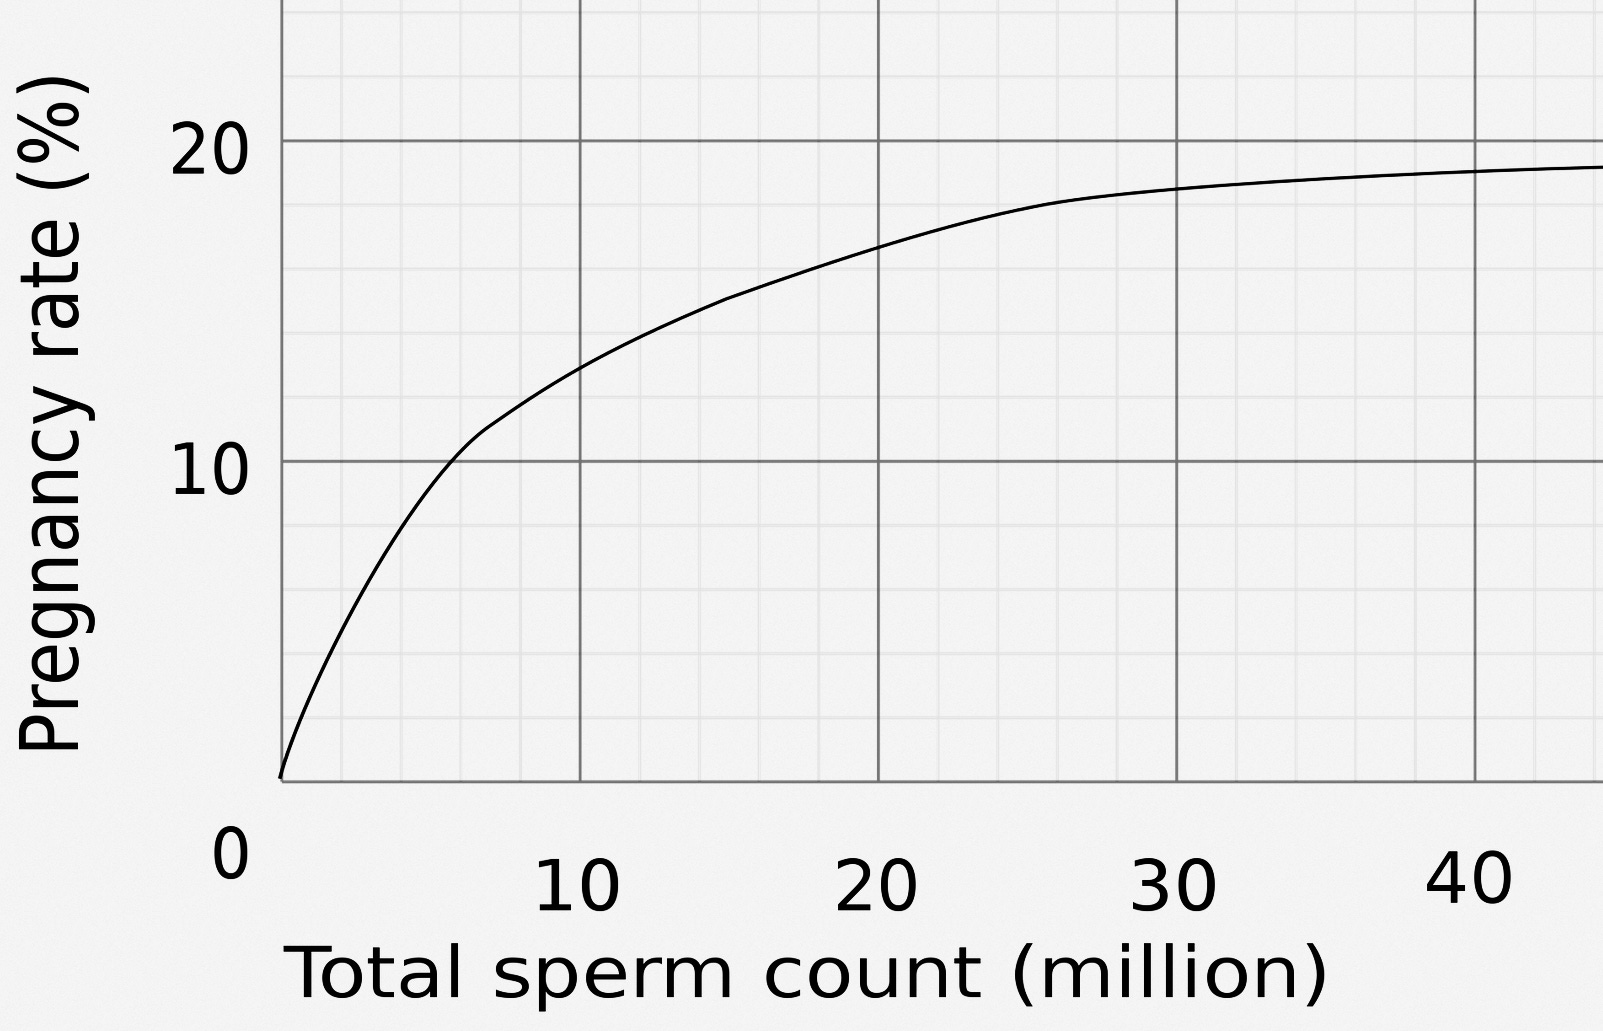
This graph (source) shows pregnancy rate by sperm count per artificial insemination cycle. It seems to plateau around 30 million.
An average ejaculation is 3 ml, so total sperm count is 3x sperm/ml. Since sperm/ml has gone down from 99 million to 47 million, total count has gone down from ~300 million to ~150 million.
150 million is still much more than 30 million, but sperm count seems to have a wide distribution, so it’s possible that some of the bottom end of the distribution is being pushed over the line where it has fertility implications.
But Willy Chertman has a long analysis of fertility trends here, and concludes that there’s no sign of a biological decline. Either the sperm count distribution isn’t wide enough to push a substantial number of people below the 30 million bar, or something else is wrong with the theory.
Levine et al model the sperm decline as linear. If they’re right, we have about 10 - 20 more years before the median reaches the plateau’s edge where fertility decreases, and about 10 years after that before it reaches zero. Developing countries might have a little longer.
It feels wrong to me to model this linearly, although I can’t explain exactly why besides “it means sperm will reach precisely 0 in thirty years, which is surely false”. The authors don’t seem to be too attached to linearity, saying that “Adding a quadratic or cubic function of year to meta-regression model did not substantially change the association between year and SC or improve the model fit”.
Still, the 2022 meta-analysis found that the trend was, if anything, speeding up with time, so it doesn’t seem to be obviously sublinear.
How Long Has This Been Going On?
The first recorded claim about declining sperm counts was in Nelson & Bunge, 1974. They noticed that sperm counts seemed to be declining since the first good study in 1951. There were some previous small unreliable studies before 1951 (the earliest was 1929) that seemed to get vaguely similar numbers to the 1951 study. So, very speculatively, one might suggest that sperm counts started declining between 1951 and 1974.
See the next section for some problems with this story.
How Sure Are We That This Is Even Real?
Not too sure.
The authors of these studies are well-respected scientists - yes, even the one who wrote the book about imperiling the future of the human race - and they seem to be doing good statistics.
But an argument against might start with this graphic:
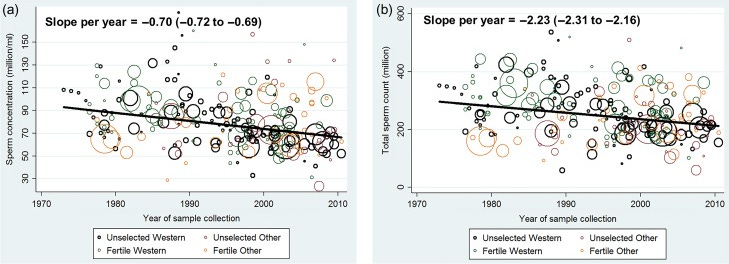 Source: Figure 2 here.
Each circle is an individual study examined in Levine’s first meta-analysis. I notice two things:
-
Yes, okay, that line is pointing very slightly down, and apparently this is statistically significant.
-
But also, the data are very noisy. Some studies from 2005 show higher sperm counts than most studies from the 1970s. The biggest pre-1980 study shows sperm counts very similar to today’s.
It looks like a lot depends on why these sperm count studies are so noisy, and how much we can trust their methodology. Here the best source is Auger et al, Spatiotemporal Trends In Human Semen Quality:
Human sperm production is widely believed to be declining over time, but evidence from the scientific literature is less clear. Studies based on repeated cross-sectional data from a single centre have shown mixed results. Among the numerous retrospective studies conducted in a single centre, only some included homogeneous groups of men and appropriate methods, and most of them suggest a temporal decrease in human sperm production in the geographical areas considered.
Conclusions reporting temporal trends in sperm production that came from existing retrospective multicentre studies based on individual semen data and those using means, medians or estimates of sperm production are questionable, owing to intrinsic limitations in the studies performed. Regardless of study design, studies on the percentage of motile or morphologically normal spermatozoa are still limited by the inherent variability in assessment.
Overall, available data do not enable us to conclude that human semen quality is deteriorating worldwide or in the Western world, but that a trend is observed in some specific areas.
Instead of comparing studies from all over the world, it might be safer to look at single-center studies, ie where a single hospital or lab has been recording sperm counts for decades, presumably using the same methods for the same population. The authors were able to find about seventy such studies. Unfortunately, they were pretty contradictory:
With respect to trends in sperm concentration (or total sperm count when concentration was not determined), 57% of studies reported a decrease in sperm production over time . . . 29% of all studies reported no change and 12% indicated an increasing trend.
Why such variable results? Here are some common confounders:
-
Where are sperm samples coming from? Some people give samples because they are sperm donors, others because they are infertile and want to figure out why. Infertile men may be infertile because they have unusually low-quality sperm. If something changes the fertile/infertile balance among sperm sample givers, or changes when people start worrying about fertility enough to give sperm samples, then data will be confounded. Especially the rise of IVF during the period under study has increased the degree to which infertile men might give sperm samples.
-
In the old days, when this was groundbreaking research, most studies were done in cutting-edge research centers in wealthy regions of advanced countries. These places tend to be healthier and have higher sperm counts. Now that this line of research has caught on, everyone is doing it, and that means more underdeveloped areas with worse health and lower sperm counts are in the dataset.
-
Sperm count is affected by age - if your area’s population is aging, that will change its average sperm count from year to year.
-
Different countries (and, in the US, different races) seem to have different sperm counts. If your community’s demographics are changing (eg immigration), that might change its average sperm count.
-
After ejaculation, sperm count decreases and takes a while to build back up again; if your community’s ejaculation frequency is changing (eg people have gained access to online porn), that will change its average sperm count.
But beyond all of this, collecting sperm is hard. Here’s Auger et al:
At the beginning of the 1980s, the WHO recommended standardized approaches for assessing human semen, which have evolved and been updated over time. However, some of the discussed studies began before the 1980s, when the WHO guidelines were implemented. In addition, many studies did not describe their methods precisely or did not follow the WHO guidelines at all. Furthermore, several studies stated that the WHO recommended procedures were followed, but the description of the procedures used suggests noticeable deviations from the recommended procedures.
Others even reported changing methods during the study period, for example, for sperm count analysis. Changing a procedure can be a notable confounding factor if the periods before and after the change are not analysed separately. For example, counting spermatozoa in a haemocytometer, a single-use calibrated chamber or a Makler chamber does not produce the same count. Similarly, changing the procedure for assessing normal sperm morphology from old WHO guidelines to the more recent WHO recommendations, which are based on stricter criteria, results in markedly different percentages of morphologically normal spermatozoa
Finally, fewer than half of the discussed studies considered inter-observer variability, including both occasional and intrinsic variability within the same pool of technicians and the changes in these pools over the years. In addition, few studies mention the existence of concomitant internal quality controls that are necessary to maintain satisfactory intra-individual and inter-individual homogeneity in semen assessment over time.
Fisch (2008) has some colorful commentary:
Obtaining human semen for scientific analysis is logistically difficult. As many authors have pointed out, the fact that semen is almost universally obtained by masturbation has placed profound limits on the ability of researchers to adequately study this issue. If collection of semen samples were as straightforward as obtaining blood samples, the nature of semen quality changes over time (if any) would have been determined decisively decades ago. A prospective, longitudinal study of semen parameters in a large, multicenter, randomized study of community-dwelling men, although time-consuming and expensive, would provide highly reliable data. Of nearly equal quality would be an analysis of a suitably sized population of randomly selected community-dwelling men analyzed by birth cohort. Unfortunately, neither of these high-quality observational tools has been used to investigate the phenomenon of semen quality because of the logistical and emotional obstacles posed by the means of obtaining semen in a timely and well-controlled manner.
However, Auger identify six (of their original seventy) studies that they say are extremely well done and suffer from none of these potential confounders. They say five of the six still show declining sperm counts, and believe that the effect might be real (they say there is no evidence it is global rather than limited to these five regions but I think if an effect happens in five regions, and there is only one region where it is not happening, it is fair to wonder whether it represents a broader trend). I interpret their conclusions as very cautiously pro-decline-hypothesis (Fisch remains against).
There is also a Harvard Gender Science Laboratory paper that the media has played up as attacking the sperm count decline hypothesis. But it is mostly written by Gender Studies professors, anthropologists, and philosophers, and mostly just says that it sounds sexist to say something bad might be happening to men (it also adds that since some studies have found the decline is higher in Europe, it’s racist for saying something bad is happening to white men). It makes a few of the points above about how science is hard and measurement error is common, but overall doesn’t make any points that Auger and Fisch don’t make better, and the authors seem very likely to be politically biased.
Did The Hypothesis Start By Mistake?
One interesting corollary of these studies being so noisy: as far as I can tell, basically every person who proposed this hypothesis before Levine et al was mistaken, and had no right to conclude this from their small samples. If they were right, it was only by coincidence.
Consider Nelson & Bunge, the seminal (sorry) 1974 paper that founded this field. They studied 390 samples, and compared to samples studied with a different technique, in a different part of the US, in 1951. Surely whatever differences they found are well within the usual range of noise?
But the hypothesis only reached the scientific mainstream in 1992, after the publication of the Carlsen et al meta-analysis. Fisch savages this in his paper, showing that with proper statistical techniques, it ought to have found an increase, rather than a decrease, in sperm concentration over the period studied.
Unless I’m misunderstanding this, it seems like to support sperm count decline, you’d have to claim that everyone who argued about it for the first forty years or so was working off of useless data, but by coincidence they happened to be right anyway.
There’s no reason this can’t be true, but it makes me suspicious.
Where Is The Decline Most Pronounced?
Levine et al don’t officially compare developed vs. developing world counts, but unofficially it looks like sperm count is declining faster in the developed than in the developing world. I can’t tell whether the difference is significant, and the decline in the developing world is either just above or just below traditional statistical significance depending on how you measure it.
Auger et al report that they found declining sperm count in:
-
83% of South American studies
-
64% of European studies
-
50% of Asian studies
-
40% of Australia/New Zealand studies
-
33% of US studies
Just eyeballing it, Scandinavian countries have less sperm decline than Central European, and Japan/Korea have less sperm decline than China. Chinese data showed some extraordinarily fast declines over the space of just 5 or 6 years, although China is sometimes known for having bad studies that prove overly interesting things, and other Chinese studies found no change.
This Qatar study compares Middle Easterners to non-Middle-East immigrants (mostly African and Indian). The Middle Easterners had significantly lower sperm concentration (37 vs. 30). Auger et al also found that Middle Easterners had some of the lowest sperm counts in their sample, with Egyptians having the lowest count measured. It’s unclear if this represents a decline or if they just started out lower.
A study of four US states found the highest sperm concentration in New York (103 million), and the lowest in Missouri (59 million). Auger et al found that Parisian sperm count was highest in city center and lowest in the outlying districts, and some people have concluded a more general principle that the decline is worse in rural areas.
In the US, black people seem to have lower sperm count than whites or Latinos.
Given how hard it is to find this effect at all, we should be suspicious that all of these differences are fake, and that actually we don’t know anything about where sperm decline is faster or slower.
What About Animals?
Many farm animals are bred through artificial insemination. That means we have very good data on farm animal sperm over long periods of time.
Some articles try to vaguely suggest animals have lower sperm count, citing studies on related topics that never quite get around to finding animals have lower sperm counts, for example this one from The Conversation.
Actual animal studies tend to find inconsistent results. For example, bull semen was getting worse from 1965 - 1980, but got better again from 1980 to 1995. Horse semen sperm count in England and France has stayed the same or maybe even improved.
Overall there doesn’t seem to be convincing evidence this is happening in animals, although given how noisy human studies are I don’t know if we should conclude anything from just three.
A commenter who works with farm animals says that as artificial insemination has become more popular, breeders have selected bulls more and more heavily for excellence at semen production, which potentially confounds these results.
If Sperm Count Is Declining, What Could Be Causing This?
The hypotheses I’ve seen are:
-
Plastics
-
Pesticides
-
Sunlight and circadian rhythm
-
Diet and obesity
-
Porn
Going in order:
Plastics are sometimes “endocrine disruptors”. They mimic reproductive hormones, causing the reproductive tract to be getting random signals all the time and develop incorrectly. This is probably the most commonly cited hypothesis.
(a plastics engineer in the comments wants me to clarify that most of the offending chemicals are technically plasticizers - substances added to plastic to change its properties - and not the plastics themselves. Phthalates are an example of this; BPA is a counterexample).
I can’t find any great studies testing this hypothesis, although there are a few weak ones with very small sample sizes finding effects of plastic exposure on sperm motility.
If sperm counts really did decline between 1951 and 1974, as the Nelson & Bunge, 1974 paper suggests, it would be hard for plastic to cause this, since plastics were still rare for most of this time period. But as I mentioned above, maybe this paper was a fluke that got it right by coincidence.
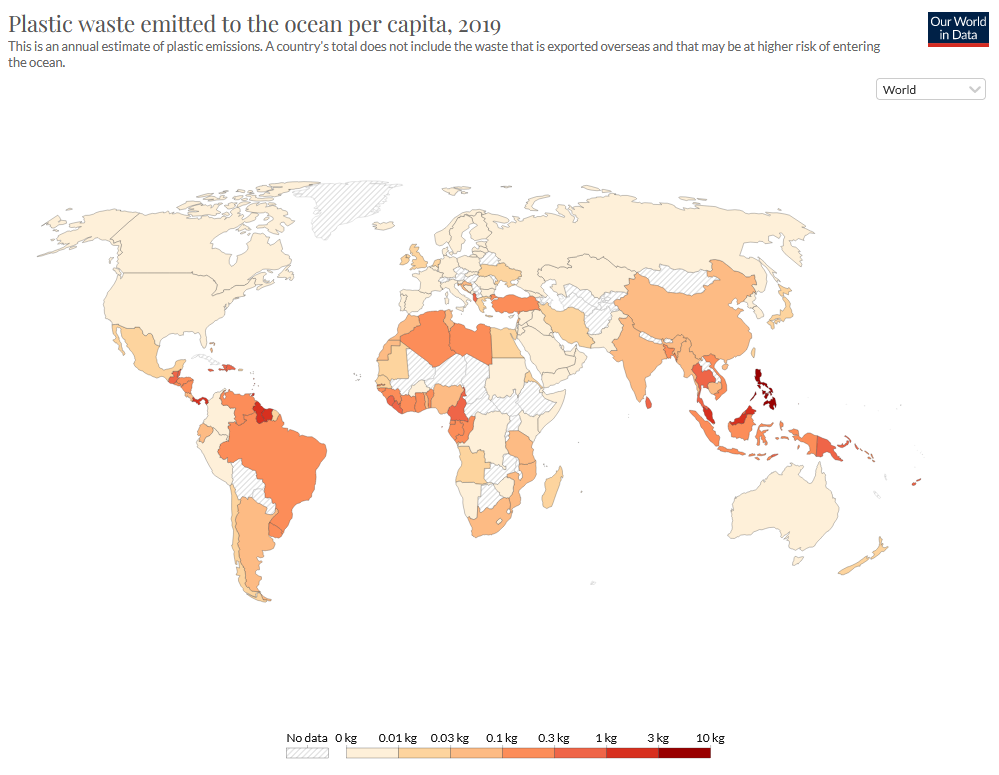
This is Our World In Data’s map of plastic waste per capita. It’s actually not a bad match for the geography of sperm count decline, though it’s not amazingly perfect either.
Pesticides can also be endocrine disruptors. This is a good match for the “Missouri is worst US state” result, and in fact that same study separates Missourians by pesticide exposure.
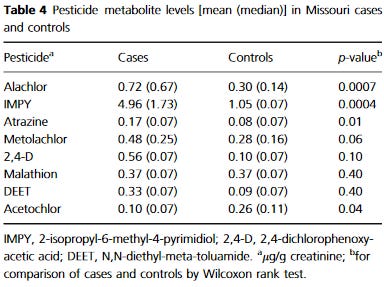
They find that “cases” with lower-than-average sperm concentration have more than twice the blood level of some pesticides than “controls”, p = 0.0007. But this is in a sample of only 50 people, all in Missouri.
Two meta-analyses (1, 2) find that 28 of 37 studies investigating a pesticide/sperm count correlation have found significant results, with some of the others only barely missing significance. The usual study designs are:
-
Compare people occupationally exposed to pesticides (eg farmers) with people who aren’t
-
Compare sperm quality with pesticide metabolites detected in the blood.
-
Compare sperm count in people who eat a lot of fruit to people who eat very little.
There is probably publication bias in this literature, and nobody has done even basic tests to look for it, but overall I find it pretty suggestive.
Sunlight and circadian rhythm are known to affect sperm count (did you know that men produce more sperm in winter than summer, and any study that doesn’t account for this is potentially confounded?) People working office jobs and staring at screens all day have worse-defined circadian rhythm, and maybe this is bad in some way.
Sperm quality displays a classic pattern where it seems correlated with Vitamin D, but supplementing Vitamin D does not improve it. This can either mean it is correlated with some other sunshine-related process we don’t understand, or that Vitamin D is a more general marker of (the relevant facets of) good health.
Only one team did the study I wanted - seeing if sperm count was lower in workers with night shifts or confusing shifts than in more regular workers; they concluded it was, but I find their results kind of weak and unconvincing.
Obesity and bad diets can impact sperm count. But the US, a world center of obesity, seems to be doing better than many less obese countries, and countries like China and France that have maintained relatively low rates of obesity and overweight seem heavily affected. If modern diets are the problem, then it has to be something more insidious than obvious you-are-very-fat obesity - unless you want to use the “all regional comparisons are too low sample size for us to care” card.
Porn hasn’t actually been proposed as a cause of declining sperm count as far as I know, but I found myself wondering about it when writing this piece. Doesn’t frequent masturbation decrease sperm count?
Yes, somewhat, for a few days. But people doing official studies usually ask men to abstain for a few days before giving samples, and when they don’t, they adjust for this as a confounder. So if this were a cause, it would have to be some kind of long-term negative effect separate from the well-established effect where you ejaculate all your sperm and can’t make new ones for a few days.
There is one extremely weak study finding evidence for such an effect. But also, many sources find that Middle Eastern countries watch the most porn, and these are also the countries with lowest sperm count. Obviously an ecological argument like this is extremely weak, even before we get to the problem where all cross-country comparisons might be bunk.
Other things that don’t get their own paragraph:
-
Marijuana decreases sperm count and people use it a lot more recently
-
Sitting decreases sperm count and more people have sitting jobs
-
Cell phone in your pocket
-
Heat is known to decrease sperm count, are we getting more of it for some reason? Global warming? Heated buildings? Laptop on your scrotum?
-
Women are using hormonal birth control, and men are either absorbing it through the water supply, or missing cues of fertility that would otherwise increase sperm production through to some galaxy-brained evo psych daisy chain.
Conclusions And Predictions
To grind my usual axe: this is the kind of complex issue that makes me wary of bias arguments and the “misinformation” framing.
If it turns out this was real all along, people will point to the hundreds of studies demonstrating it and prestigious scientists pushing it. Doubters will be compared to global warming denialists, ignoring science in order to continue their fantasy of consequence-free pollution.
And if it turns out this was totally fake, people will talk about how this was a classic panic of fragile masculinity (“our precious bodily fluids!”). They’ll place it alongside ivermectin in the annals of “don’t trust small noisy studies”.
In retrospect, it will feel obvious that one side was right all along and the other was laden with junk science, biases, and all the classic red flags for conspiracy theories. We’ll be told we should have “trusted the experts” - either experts like Levine and Swann saying it’s real, or experts like Auger and Fisch saying it’s overblown.
But right now, not knowing which side is right, we don’t have any of these easy outs. We have to actually reason under uncertainty!
I’m not actually very good at this in this situation, and I’m pretty split about how concerned to be. Trying to turn this into concrete predictions, with a market for each:
1: In twenty years, the best evidence will suggest that sperm counts have been substantially declining across most of the world: 50%
Auger and Fisch make great points about confounders and measurement difficulties. Nobody denies how noisy these data are. I think the case in their favor is that there are so many studies that you’d need a strong directional bias to explain the strong directional finding - plus the sheer magnitude of the effect, from counts of 100 million + in the Fifties to ~40 million today, is impressive.
I wrote this post at the same time I wrote my response to Alexandros Marinos on ivermectin. If I applied the same hyper-skeptical eye to these studies that I apply to the ivermectin studies, they fail. But I admitted I was more cynical than usual about the ivermectin studies because of the many large RCTs that found no effect. Should I be more forgiving here? I’m not sure.
2: In twenty years, the best evidence will show very substantial ( >one quarter) declines in fertility rate (relative to couples trying equally hard to conceive in the past) due to decreasing sperm count, in at least one country: 20%
If sperm counts are declining as fast as Swann and Levine think, this should definitely happen.
So why is my number for this prediction so much lower than for the one above? Partly because the decline could be sublinear. Partly because the decline could stop - either because we identify the cause and correct it, or for more mysterious reasons. But partly it’s just an unjustifiable penalty for something that it seems very hard to imagine happening.
3: Conditional on a consensus 20 years from now being that sperm count was declining, scientists will believe the most important factor is:
-
Plastics: 25%
-
Pesticides: 30%
-
Sunlight and circadian rhythm: 2%
-
Diet and obesity: 13%
-
Porn: 5%
-
Something else: 25%
Pesticides mostly going off the many studies supporting this hypothesis; plastics mostly going off superficial plausibility and the number of scientists talking about it.
[Thanks topaid subscribers for reviewing an earlier draft of this post.]