Lockdown Effectiveness: Much More Than You Wanted To Know
Back when everyone was debating lockdowns, I promised I’d come back to it after there was more data. God willing, the pandemic is over enough that we’ve got all the data we’re going to get. So: did lockdowns work?
There’s no way to answer this completely and taking into account every relevant factor, so I’m necessarily going to be simplifying things and focusing on some aspects of the question more than others. Sorry.
Preliminary Theoretical Issues 1: What Is A “Lockdown”?
Obviously “lockdown” is underspecified. There are many things you can do to reduce transmission of viruses. Researchers have taken two different approaches here.
First, they’ve looked at the effects of specific policies (called “non-pharmaceutical interventions” or “NPIs”). A typical categorization system is the one used in Brauner et al, which looks at:
- Banning gatherings > 1000 people
- Banning gatherings > 100 people
- Banning gatherings > 10 people
- Closing schools
- Closing universities
- Closing some non-essential businesses
- Closing most businesses
- Stay at home orders
…and tries to separately evaluate the effects of each. Other studies categorize these slightly differently - for example, they might combine school and university closure. Not all countries implemented exactly these eight policies in the exact same way, so in some cases these are abstractions over more complicated orders. Studying these tends to be very hard, either because different countries are doing different combinations of these at different times, or because countries implement many orders at around the same time and it’s hard to figure out which are having any effect.
Second, they’ve invented a “stringency index”, where having each of the above adds a certain number of points to your “stringency score”. The advantage of this is that it’s a simple statistical test - you can just correlate “stringency score” with R values or cases or deaths or whatever. The disadvantage is that it’s kind of made up - you’re at the mercy of whatever the person designing the stringency score thinks is “common sense” about how many points everything should be worth. Most people using this method use the score developed by the Blavatnik School of Government at Oxford, and whenever I refer to “stringency score” without any other specifications, I’ll mean that one. I looked it over and it roughly matches my common sense - the US states which everyone knows had stricter lockdowns also had higher stringency scores.
Preliminary Theoretical Issues 2: What Point Are We Measuring At?
If, the moment COVID had been reported in Wuhan, other countries had closed their borders tightly, that would have prevented the pandemic (at least for a while). In that sense, lockdowns definitely could have worked.
If, the moment a country started getting cases, it had instituted an extremely strict lockdown where police shot anyone who left their house, presumably this would have prevented the pandemic (at least for a while) too. Only a few countries (eg China) approached anything like this level of strictness, but at this dictatorial extreme, lockdowns definitely could have worked.
Australia and New Zealand managed to do very well by combining well-targeted border closures with very strict early lockdowns. This helped them get cases low enough to the point where their test-and-trace program could manage them, and helped them get through the pandemic relatively gently (so far). This was a great strategy for the countries that were quick-thinking, clear-thinking, and lucky enough to pull it off, ie very few of them.
Most of the debate about whether lockdowns work centers on ideas within the Overton Windows of western countries, after the pandemic had started spreading and test-and-trace had been (maybe unwisely) abandoned. That is, given whatever level of lockdown your average western country had, was the marginal effect of more (or less) lockdown positive or negative? This post will continue the tradition of addressing this depressing and unambitious question.
Preliminary Theoretical Issues 3: What Is “Working”?
What would it mean for lockdowns not to work? We know that viruses spread through person-to-person contact. Lockdowns make people see each other less. How could this not reduce viral transmission?
I think there are worse and better cases here. One worse case is that lockdowns weren’t absolutely necessary to “flatten the curve”. That is: during the earliest phase of the pandemic, in March and April 2020, cases were growing exponentially. People were afraid that the virus would soon infect everyone (or more realistically, the 70% of the population it takes before you get herd immunity). But in fact, every country managed to reverse this trend and get cases shrinking again quickly. Some countries did this with strict lockdowns. Other countries had much weaker lockdowns, but after things got crazy enough people panicked and stayed home on their own, and this worked too.
So one anti-lockdown case - a true one - is that you could eventually control the explosive growth phase of the pandemic without lockdowns. But this is asking too little. If you control the explosive growth phase after 20,000 people die, this is obviously worse than if you control it after 10,000 or 0 people die. And the explosive growth phase was followed by further ups and downs, and if you could control those better, that’s obviously better than controlling it worse. So granting that lockdowns weren’t necessary to prevent uncontrolled spread, let’s still ask whether they made things better or worse.
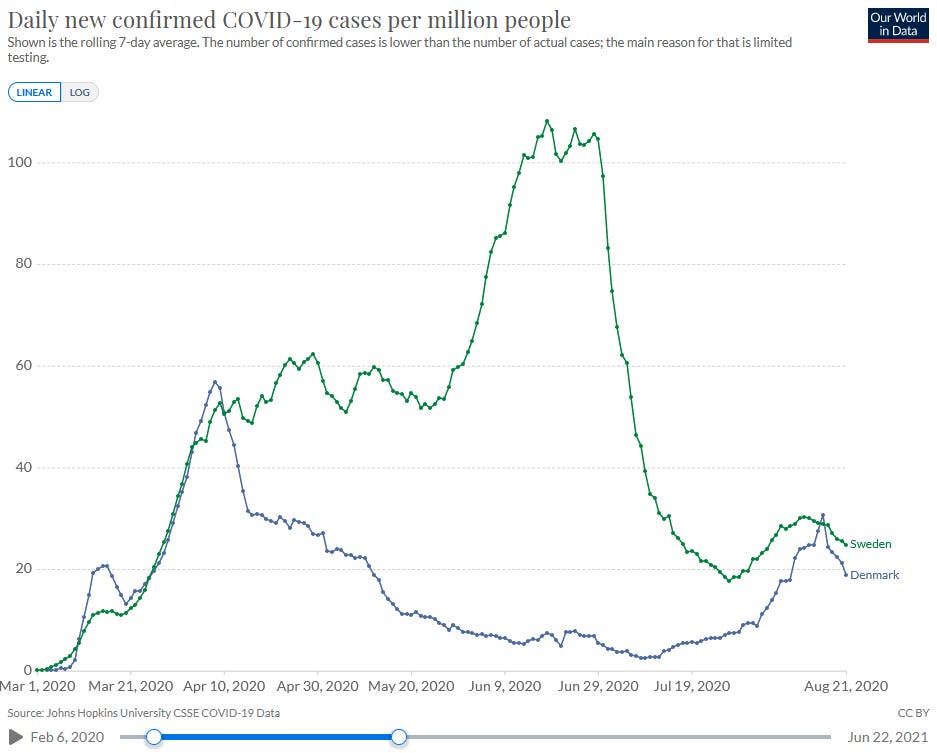 Both Denmark (stricter lockdown) and Sweden (weaker lockdown) were eventually able to control the explosive growth phase of the pandemic, but that doesn’t mean they both did equally well.
More relevant anti-lockdown cases argue that lockdowns just don’t have a great cost-benefit ratio. That is, at least some lockdown policies cause a lot of suffering for very little decrease in R. We know this is possible in principle - some states tried things like closing parks and trails, which in retrospect probably wasn’t too useful since the virus doesn’t spread well outside. Other things like banning large gatherings are more promising, but you might have to argue for each of these individually.
Preliminary Theoretical Issues 4: How Do You Count Voluntary Behavior Change?
A lot of anti-lockdown arguments are predicated on the theory that voluntary behavior changes alone are potentially enough to control the virus (though again, this terminology is confusing and would have to be expanded into a claim that involuntary behavior changes have a low marginal cost-benefit ratio).
There’s a lot of evidence that voluntary behavior changes were pretty important in some places. For example, here’s mobility data from the San Francisco Bay Area:
It’s pretty evident from this graph that people were starting to decrease their mobility before any official government action, and that most of the decrease happened before an official shelter-in-place order.
How common was this trend? It’s hard to say, because most governments started panicking around mid-March and instituting lockdown orders then, and most individuals started panicking around mid-March and making their voluntary behavior changes then, and in most places it’s really hard to figure out which of these things happened a day or two before the other. In most European countries, which had lockdowns early, there wasn’t much behavior change before lockdown orders; in some developing countries, which had lockdowns late, there was a lot of behavior change before lockdowns.
Goolsbee and Syverson study the US situation and find that “while overall consumer traffic fell by 60 percentage points, legal restrictions explain only 7 of that. Individual choices were far more important and seem tied to fears of infection.”
Some research papers ignore the possibility of voluntary behavior changes, which makes their conclusions suspect. Others try to include them, but have to figure out a way to incorporate them into their conclusions. Suppose that your country closes all restaurants. The next weekend, you don’t go to a restaurant. You would have voluntarily chosen not to go to the restaurant even if it was open, because you’re afraid of coronavirus, but in fact you didn’t get to make that choice, because the restaurant was closed. If that missed restaurant trip saved your life, should we credit it to the lockdown, or to voluntary behavior change?
It feels to me like the important issue is the counterfactual - how many lives did lockdowns save over the world where there were no lockdowns,
and only voluntary behavior change? But not all researchers feel that way, and so a lot of the lockdown papers, even the ones that admit voluntary behavior change is a thing and include it in their models, have a complicated relationship with this question.
Preliminary Theoretical Issues 5: Voluntary Behavior Change Is Actually Pretty Complicated, Isn’t It?
Here in the Bay Area, some parents tried to take their kids out of public school in early March, before the official lockdowns. The schools got angry, threatened to prosecute the parents under truancy laws, and said kids who missed school due to COVID fears wouldn’t be allowed to make up the work later and might fail their classes. Then later on, the government closed all schools and people stopped having to worry about this.
Likewise, my group house tried to shut down two weeks before the official mandate. We failed, because one resident’s company wouldn’t let them work remotely, and they had to take the train to San Francisco every day. Then the government closed all businesses, and that solved that problem.
The moral of the story is that everything not forbidden is compulsory, so you can’t always substitute voluntary behavior change for government mandates.
On the other hand, a lot of government mandates didn’t work because they weren’t enforced. Leech et al investigate the efficacy of masks and find that mass-scale mask wearing decreases COVID transmission significantly. But they’re not able to find much evidence that government mask mandates help. How to solve this paradox?
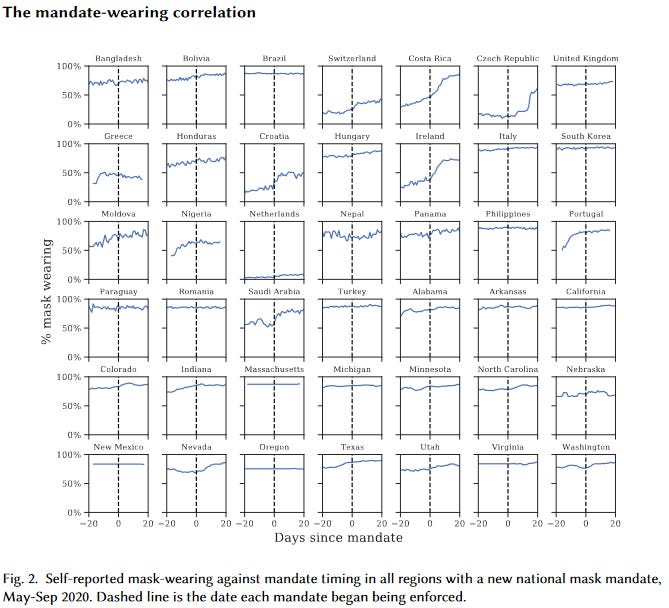
It looks from the data like mask mandates barely affect the number of people wearing masks - on average, about 64% the day the mandate is enacted, and 75% three weeks later (and even this isn’t necessarily causal!) One possibility is that their data (based on surveying people about whether they wore masks recently) isn’t very good. But another possibility is that people who wanted to wear masks probably were already wearing masks; people who didn’t want to wear masks weren’t going to let the government tell them what to do. This doesn’t mean mask mandates can’t work - a lot of these mandates were poorly specified and poorly implemented - but it does mean you can’t go directly from “policy exists” to “policy is doing what you expect”.
Similarly, there was a really wide diversity of compliance levels with shelter-in-place orders. I know some people who didn’t see their closest friends for months, and others in the same cities who said “screw this” after a week or two and started having (small) parties again.
So some interventions (eg school closure) are very easy for governments to enforce and very hard for individuals to change their behavior voluntarily. Others (eg shelter-in-place) are very hard for governments to enforce and very easy for individuals to change their behavior voluntarily. We might expect mandates for the first group to show more of an effect (beyond counterfactual voluntary behavior change) compared to the second group, even if the second group is the sort of thing that prevents COVID (eg mask-wearing).
Finally, voluntary behavior change and mandates are hard to separate. If you hear the government is thinking of a mandate, that might make you scared and cause you to do things voluntarily (even things not included in the mandate). Or if the government knows that most people are staying at home, it might feel more comfortable issuing a stay-at-home order to mop up the last few holdouts, whereas if no one had been staying at home it might not be willing to do that.
Preliminary Theoretical Issues 6: The Pandemic As A Control System
A control system is a thing like a thermostat. When it gets too hot, the thermostat kicks into cooling mode and makes it cooler. When it gets too cold, the thermostat kicks into heating mode and makes it warmer. So the temperature always stays around the same level.
At times, people’s response to the pandemic operated kind of like a control system. When the pandemic started getting worse, everyone panicked, voluntarily self-isolated, and the pandemic got better. When the pandemic started getting better, everyone relaxed, started going out and meeting people again, and the pandemic got worse. This kept R around 1 for a lot of places at a lot of times. R only shifted away from 1 when the control system broke for some reason - maybe because the pandemic started getting worse more quickly than people could hear about it and adjust their behavior.
In a perfect control system, lockdowns would have no effect, because R would stay at 1 no matter what you did. In an imperfect control system, lockdowns would have some effect, but it would be harder to predict. For example, they might decrease the size of peaks and troughs - ie help the control system become more efficient.
Actual Evidence 1: Extremely Complicated Studies About Europe During The First Phase Of The Pandemic
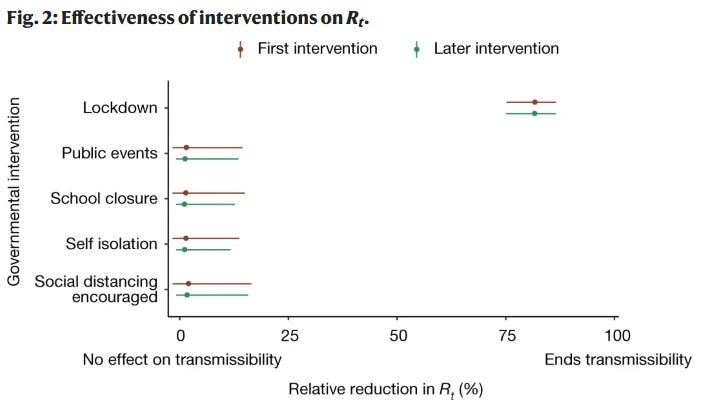
Probably the most-cited study (1177 times!) on the effect of lockdowns is Flaxman et al from mid-2020. They look at European countries during the first wave of COVID in March 2020, when they instituted various policies, and how that affected virus transmission. They find that nothing except mandatory lockdown (which I think they’re using to mean full shelter-in-place orders) did anything, mandatory lockdown was extremely effective, and that lockdowns saved about three million lives.
This study has been heavily criticized, I think fairly, with especially good critiques coming from blogger Philippe Lemoine, a Swedish team published in Nature , _and a German team in Frontiers In Medicine_. They converge on a few points. First, a bug in the model attributes almost all of the transmission reduction in a country to whatever the last intervention was that the country tried. Since most countries started with weaker interventions and then moved on to full lockdown, the model concluded that full lockdown was responsible for almost all the transmission reduction. In the one country that didn’t institute lockdown during the period studied, Sweden, there’s about the same amount of transmission reduction, but the model attributes all of it to the last thing Sweden tried - a ban on public gatherings - even though in every other country it says such bans had no effect.
But also, the model assumes that, absent lockdowns, there would have been no voluntary behavior change. In fact, we know there was a lot of it. The claim that “lockdowns saved three million lives” is compared to the counterfactual where nobody responds to the virus in any way and it spreads uncontrollably until 70% of the population has been infected. But in Sweden, which didn’t have a full lockdown, only about 1%-10% of the population was infected during the first wave. So the “three million” number is at least an order of magnitude too high. I find all of this pretty damning. I think the pro-Flaxman case is that a lot of these issues were admitted in the paper - eg it says it’s going to assume that all transmission reduction comes from government interventions. But it didn’t admit all of them - and also, if you include very small print saying “by this way, this is based on false assumptions”, it turns out people still make it headline news and base policy on it.
An influential anti-lockdown paper - though cited more in the news than the scholarly literature - is Did Lockdown Work? An Economist’s Cross-Country Comparison by economist Christian Bjørnskov. It avoids the need for complicated models by using an index of lockdown strictness as the independent variable instead of looking at specific interventions, and uses deaths as the dependent instead of estimating transmission rate. Neither of these are a terrible choice, they’re just going to be less sensitive. Bjørnskov’s excuse is that he’s an economist and wants to do this using economic techniques instead of epidemiological ones (the study is called “An Economist’s Cross-Country Comparison”), but this makes his analysis less sophisticated.
Anyway, he finds that lockdowns make many more people die - which isn’t technically impossible , but given how weak his analysis is, I would rather believe he is confusing cause and effect. He claims we don’t have to worry about endogeneity (ie countries are more likely to institute lockdowns when many people are dying) because he checked and it takes three weeks for increasing coronavirus mortality to be reflected in lockdowns, but I’m not sure exactly how he did this - the epidemic was growing at a pretty constant rate throughout this period, and policymakers instituted lockdowns once it became impossible for them to miss. As we will see later, everyone who does worry about endogeneity finds it’s actually a big problem. His backup plan of using the degree to which national constitutions allow emergency powers for the executive as an exogenous variable - because the more emergency powers are allowed, the stricter a lockdown a country can do - has way too high a cuteness-to-relevancy ratio for me to trust it.
The study in this group I find most credible is Brauner et al, which -
[conflict of interest notice: when California legalized marijuana, a friend and I decided to celebrate by getting high. My friend had a bad trip and started freaking out that they were going to die. I told them they weren’t, and they told me that I was high and so they couldn’t trust my judgment. We started IMing various people we tangentially knew, and finally one of them very kindly agreed to come tripsit my very high friend at 11 PM. That person is one of the co-authors of Brauner et al, and that is my conflict of interest]
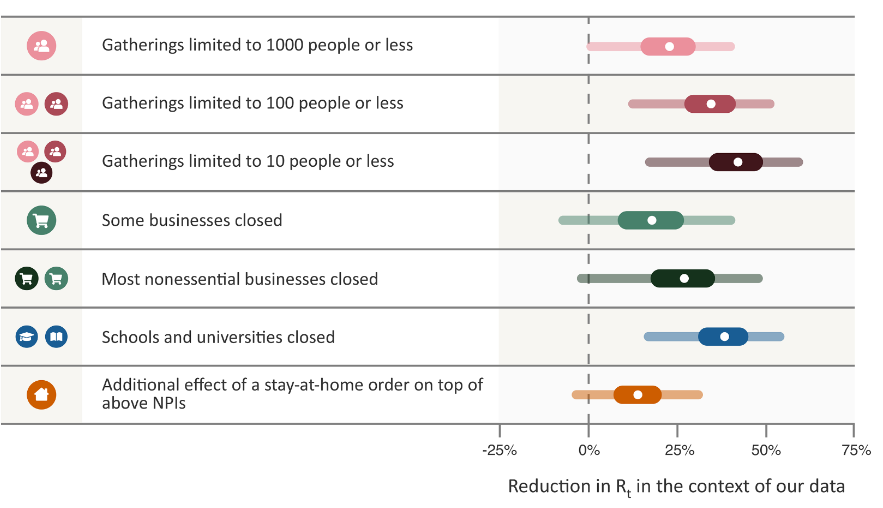
- tries something similar to Flaxman et al, but with better models and assumptions. It looks at eight different types of interventions across 41 different countries, and uses Bayesian statistics to try to merge them into a common picture of how each affects R. Here’s their headline result:
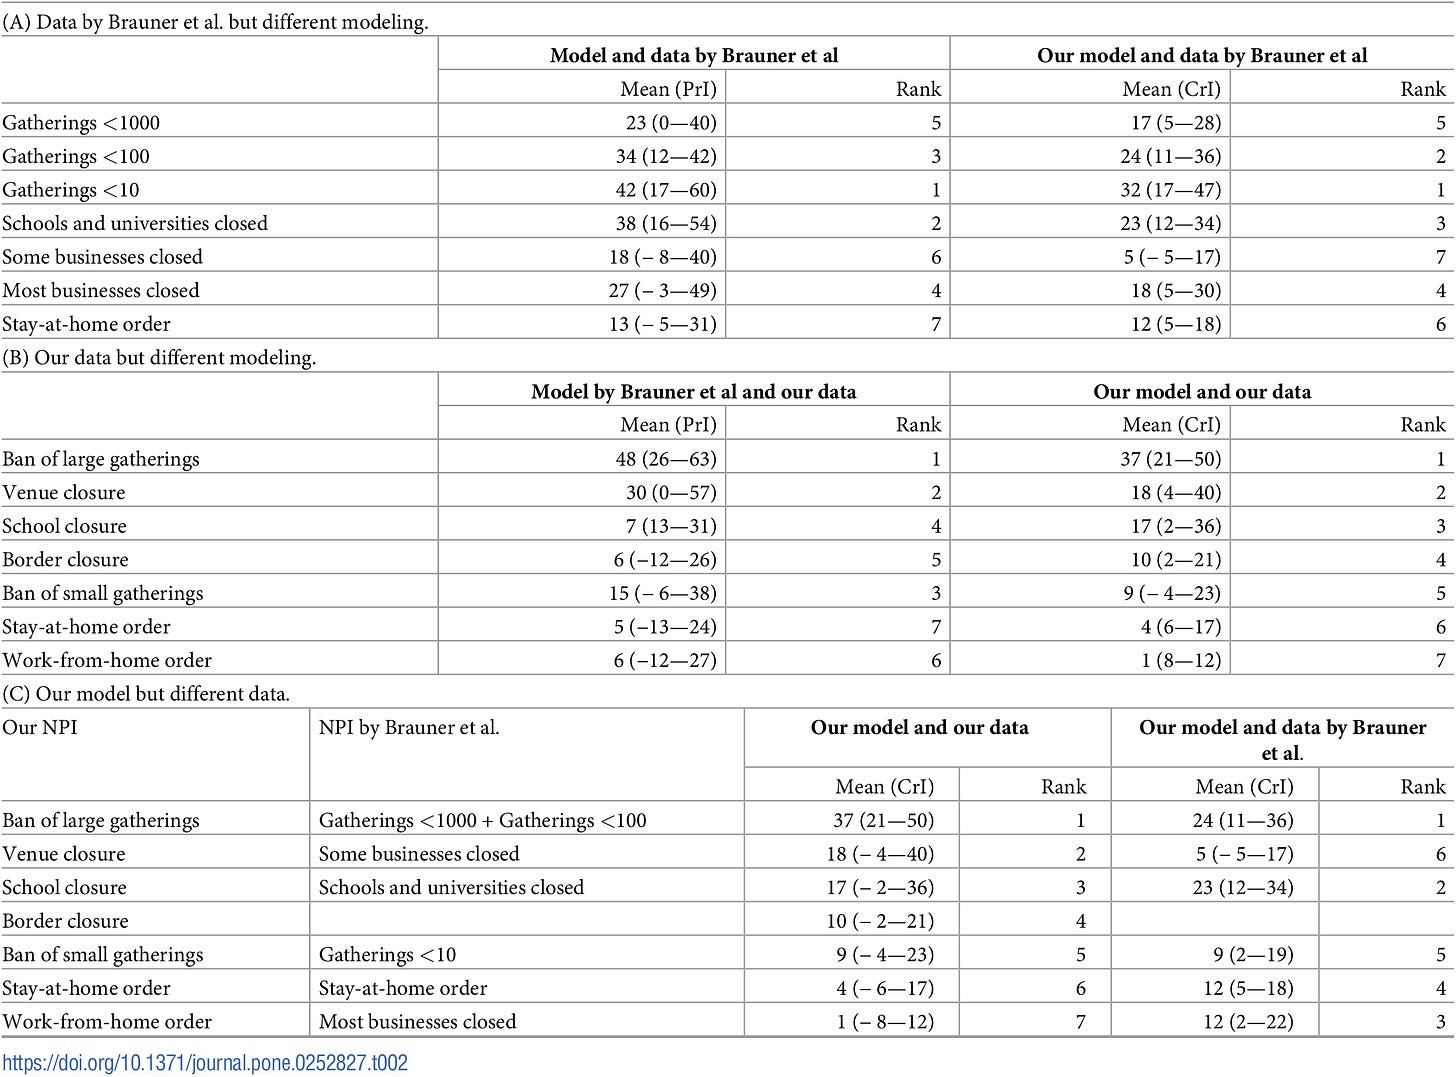
A couple other people try to do something really similar; extra points to Banholzer et al, who have a section comparing their results to Brauner; they find broadly similar effects:
A few large interventions decrease R as much as 40%, most things are between 10 and 25%, and stay at home orders are relatively weak.
I think all of these are pretty plausible estimates, but it’s hard to translate them into performance vs. a counterfactual. If we start with an R of 3 or so, then apply all of the interventions these kinds of papers study, we get an R lower than 1. That suggests that these interventions took countries from a relatively uncontrolled epidemic to a well-controlled one. But we can’t necessarily say that a country that didn’t implement any of these would continue having an R of 3 forever (or until herd immunity kicked in) - probably there would be a lot of voluntary behavior change and the overall results would be unpredictable.
So if you’re asking “did government mandates decrease R in the short term?” these studies provide decent evidence that the answer is yes. If you’re asking questions about how many people would have died with vs. without lockdowns, that’s a much more complicated question.
Actual Evidence 1.1: CoronaGame
…which you can get a surprisingly good sense of by playing a quick free online game.
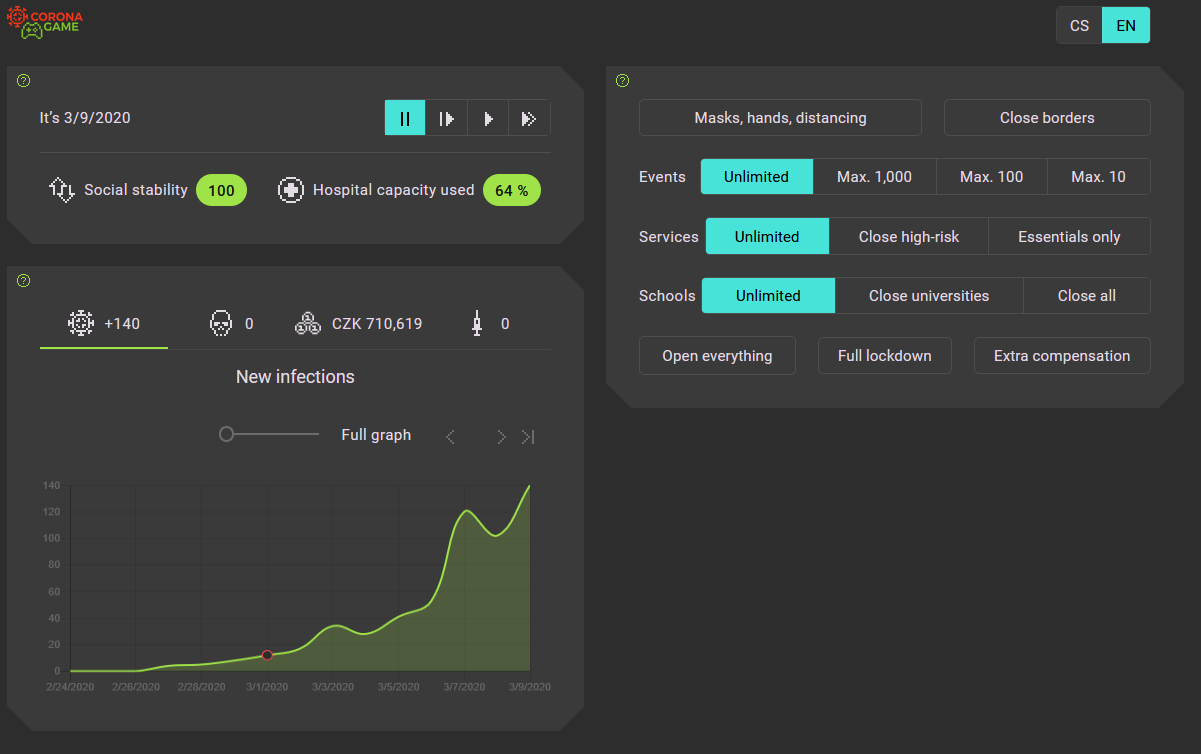
CoronaGame gives you the role of a Czech health official charged with choosing when to initiate vs. stop various preventative measures. You get points for preventing coronavirus cases and deaths, but also for minimizing economic costs and damage to public morale. The game’s model is based on the Brauner et al data, so if you believe the paper it should be a pretty realistic look at how different policies would have worked.
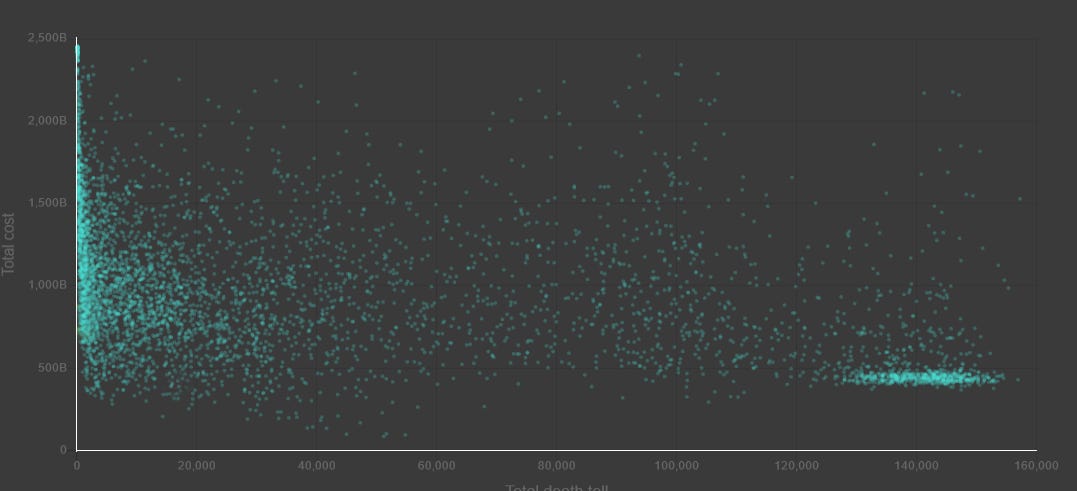
Here’s a graph of how players have done (economic damage on the vertical axis, deaths on the horizontal).
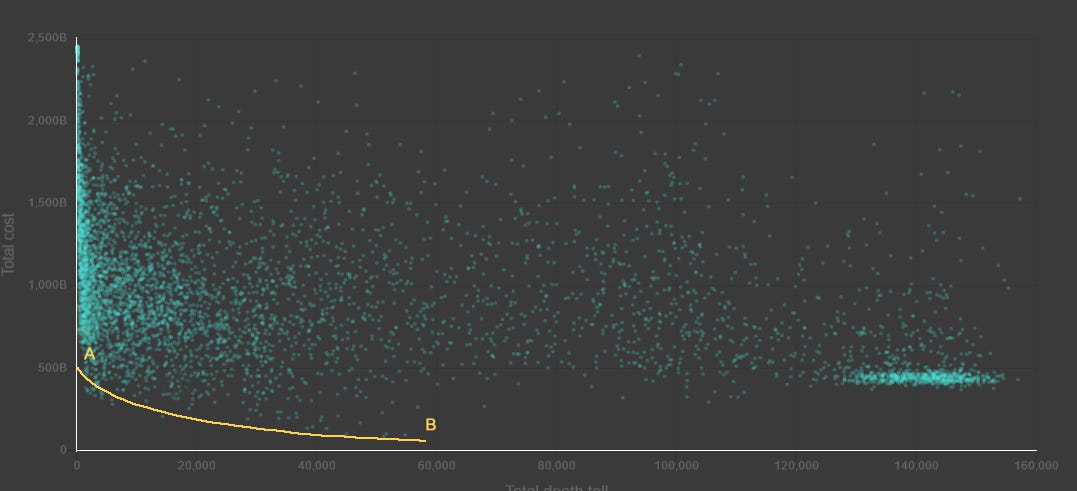
In a blog post, one of the researchers who worked on the game talks about how you can view this as a Pareto frontier:
…ie a line of choices representing a particular tradeoff made as effectively as possible. Point A, at the top of the frontier, represents a perfectly effective planner trying to maximize lives saved, without worrying about cost (except that if two plans save the same number of lives, they will use the lowest cost as a tiebreaker). Point B, at the bottom, presents the opposite - minimizing cost perfectly effectively, using lives saved only as a tiebreaker. The rest of the yellow line represents trading off between lives and cost at some exchange rate, while maintaining perfect effectiveness; the higher the exchange rate, the further along the line you go. In a perfect world, we would be debating where on the yellow line to be.
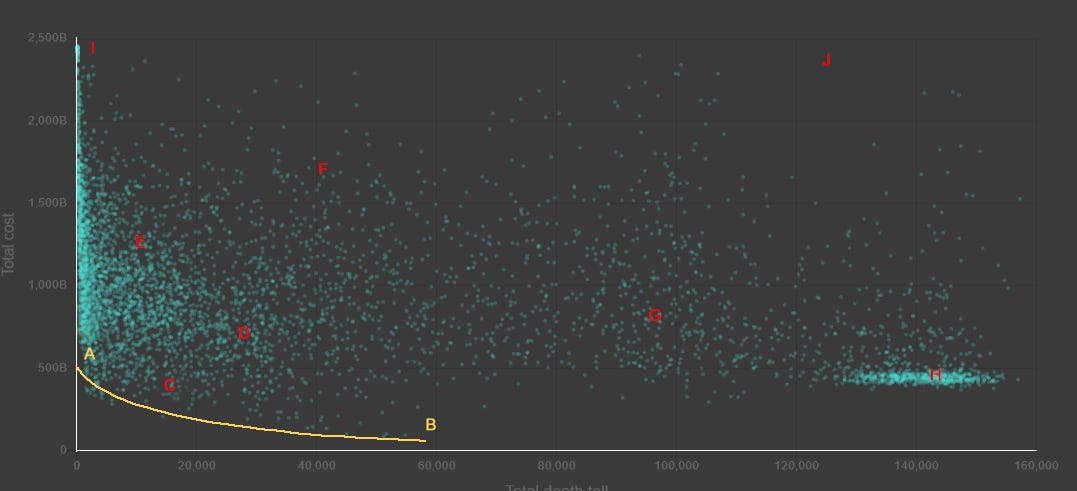
In the real world, where we aren’t perfectly rational and efficient planners, it’s totally possible to end up arbitrarily far away from the Pareto frontier, eg the points in red. These represent various plans that are not the result of a perfectly effective planner using some tradeoff between lives and cost - in other words, somebody screwed up. They are bad plans which could have saved more lives while not costing any more money, or else could have saved more money without costing any more lives. For example, Point I is what you get if you just institute every single restriction you can think of, and refuse to ever lift any of them.
(the real Czech Republic ended up at Point C)
One of the morals that the designers of this game were trying to drive home is that the discussion we’re having in this post is unvirtuous. It’s political point-scoring - did Team Pro-Lockdown win more glory than Team Anti-Lockdown, or vice versa? The real question we should be asking is what set of policies countries should have implemented.
On my best playthrough of CoronaGame, I instituted all possible restrictions throughout March, April, and May, kept cases controlled enough to institute test-and-trace, switched to a pretty minimal suite of restrictions in the summer, then instituted school closures, gatherings <10, and high-risk business closures during the winter, relaxing them gradually as more people got vaccinated (I still didn’t quite make it to the Pareto frontier, so there’s room for improvement on this strategy). Trying these same restrictions but at different times turns out to be a disaster, which really emphasizes the point that there’s no single “best level of lockdown”. The right thing to do is whatever combination of policies in whatever order gets you on the Pareto frontier in CoronaGame (I still haven’t figured it out!), which means instituting the exact right set of restrictions at the exact right times to minimize cases, then lifting them at the exact right times to minimize cost.
Then , once you’re on the Pareto frontier, you can argue about which direction on that frontier to move - a little further toward stricter lockdowns / more lives saved, or toward looser lockdowns / fewer lives saved. If you’re not on the frontier - if you’re arguing about whether to be at Point F vs. Point G - probably you should shut up and work on getting on the frontier first.
The rest of this post mostly ignores this lesson and continues arguing about which of the various suboptimal policy packages that different states and countries adopted worked better than which other ones.
Actual Evidence 2: Sweden As Counterfactual
Sweden famously did not lock down as strictly as some other European countries at the beginning of the pandemic. How did it do?
Before answering, let’s go over some more Preliminary Theoretical Issues - was the Swedish lockdown actually less strict than that of other countries?
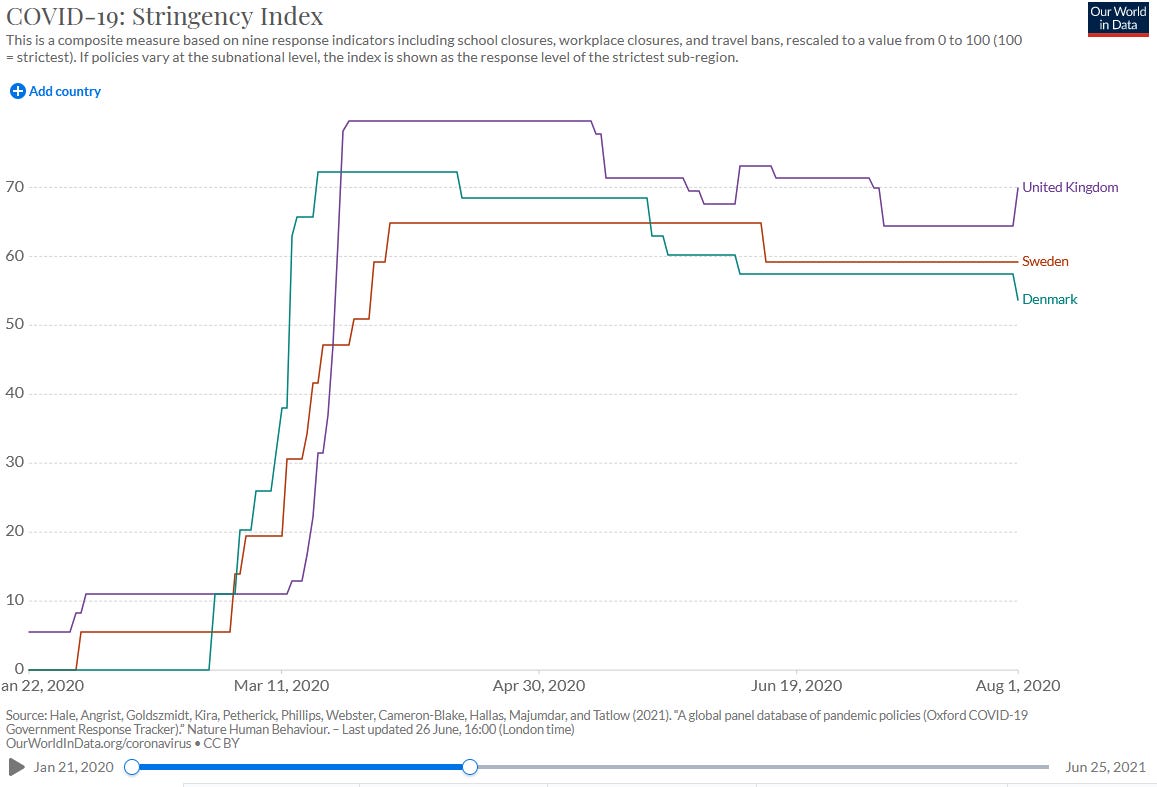
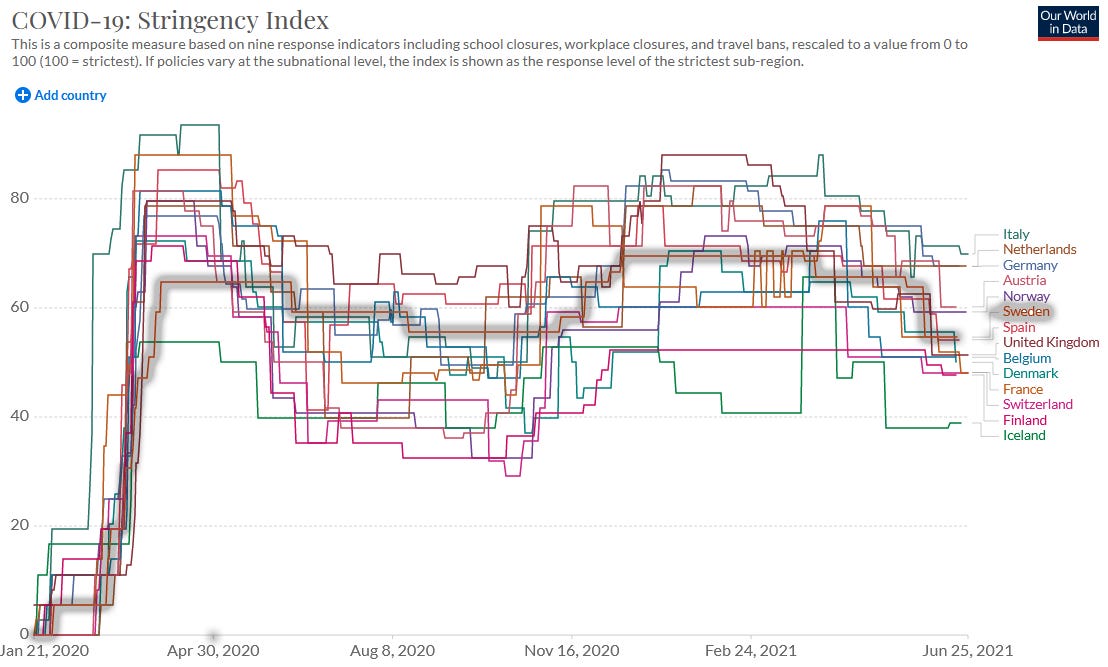
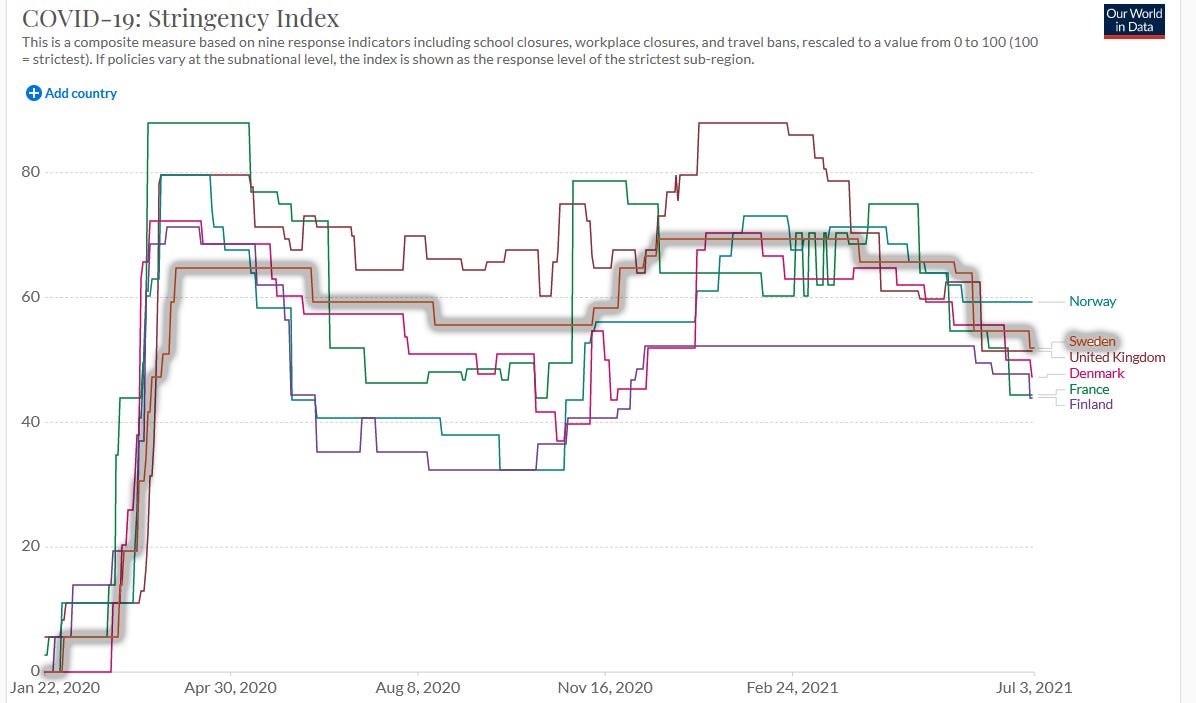
Here’s the Stringency Index during the first phase of the pandemic. Sweden is slightly lower than Denmark and the UK (two countries it’s typically compared to), but it doesn’t seem like a big difference, and by June Sweden is stricter than Denmark. What’s going on?
I looked into how the Stringency Index was composed. On April 1 (selected for being a round number in the middle of the pandemic), Sweden had an SI of 59, compared to Denmark’s 72 and Britain’s 80. Sweden had closed some public schools (other countries had closed all of them), restricted large gatherings (other countries had restricted all gatherings), “recommended” closing businesses and staying at home(other countries had mandated it), and closed public events. So Sweden did have a lot of restrictions, but the common sense perception that it had fewer restrictions than most other countries is true.
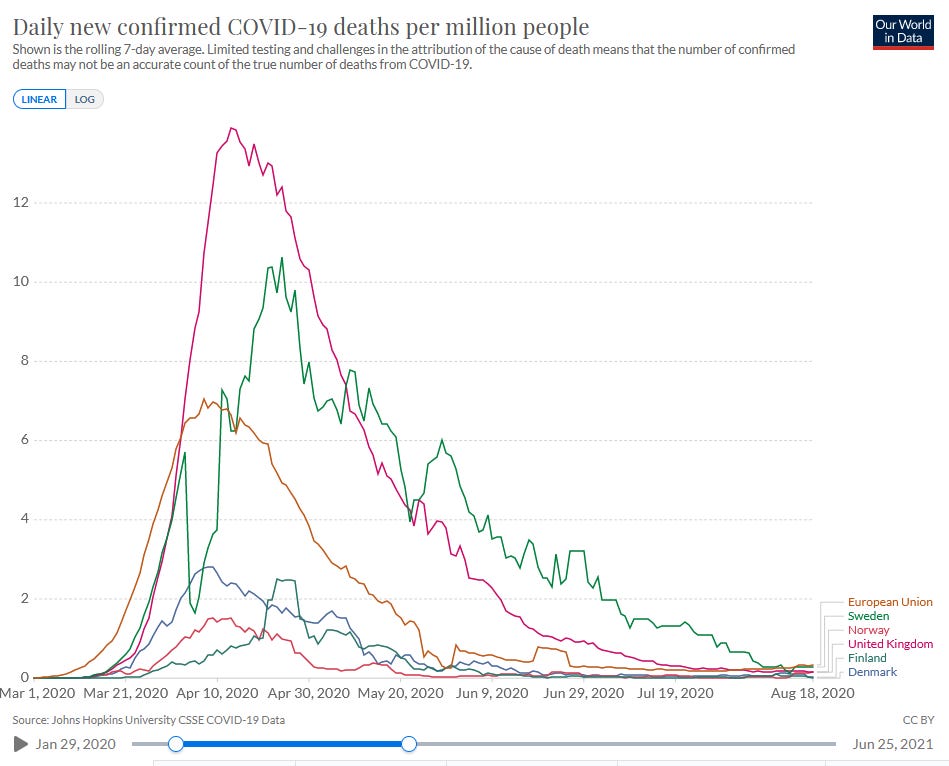
So how did Sweden do? Here’s the first phase of the pandemic, in spring and summer 2020, comparing Sweden to Norway, Denmark, Finland, the UK, and the European average:
Some people are skeptical of case numbers because it’s very dependent on testing, and prefer death numbers, since deaths are harder to miss. I’m a little skeptical of this, because death numbers get biased by how old a country’s population is and how good its health care system is, but here are death numbers for the same countries:
Cases in Sweden don’t seem to rise faster than anywhere else at the beginning. But while other countries get their epidemics under control quickly, Sweden is only able to level its out, and soon has much higher cases than any other country in the comparison group. In the deaths graph, Sweden does much worse than any other country besides the UK, and still is doing worse than the UK by the end.
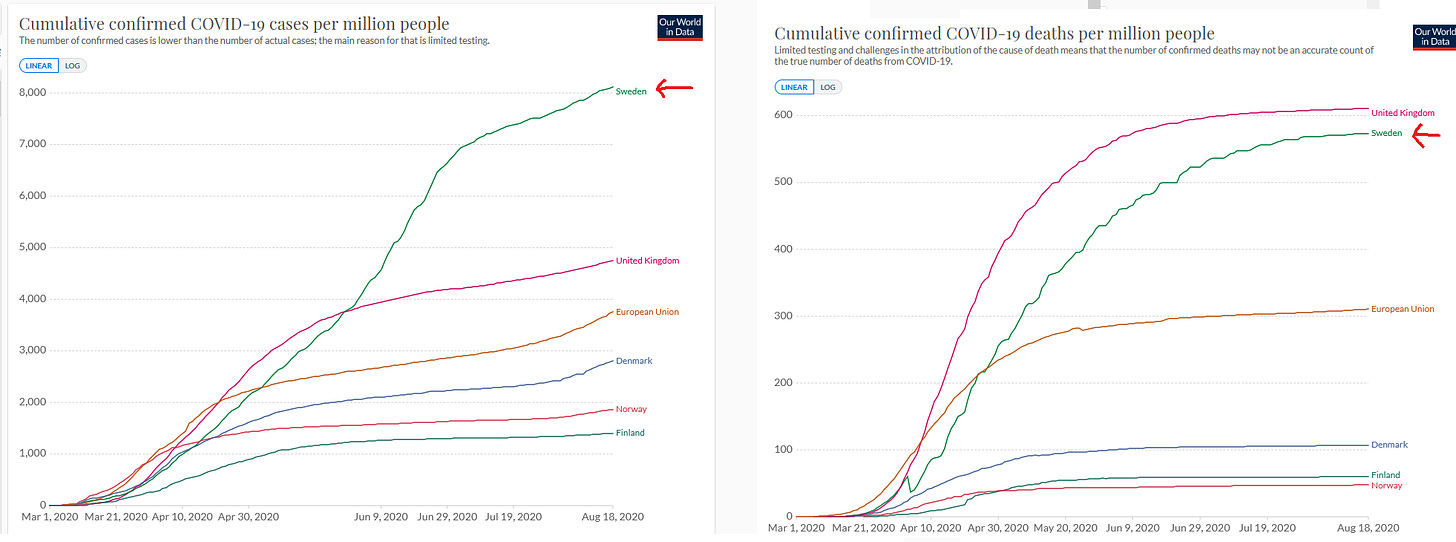
Here’s cumulative cases and deaths over the first phase of the pandemic, first with the same comparison group (Sweden in green with a red arrow):
And with lots of other developed, large, or especially interesting countries:
Sweden comes out looking very bad, but not the literal worst.
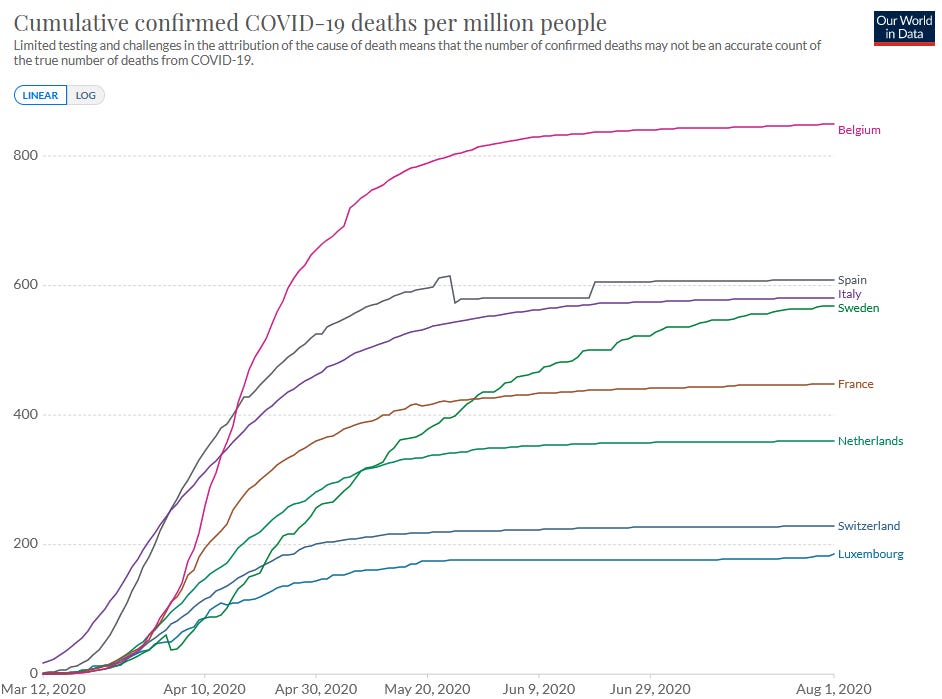
Still, most places that were worse than Sweden had good reasons to do worse than Sweden. Italy was hit very early and has the highest percent of elderly people in Europe. The US and Brazil were very large diverse countries with bungled federal responses and borderline-COVID-denialist leaders. Belgium counted its coronavirus deaths in an unusual way that inflated the numbers relative to other countries. In the end, Sweden still ended out with a death rate about double the European average. Seems pretty bad.
But it looks even worse when you compare Sweden to other Scandinavian/Nordic countries. Nobody agrees on exactly what “Scandinavian/Nordic” is, but here’s Sweden vs. Denmark, Norway, Finland, and Iceland:
Sweden had about six times the first-phase death rate of the second-worst Scandinavian/Nordic country, Denmark.
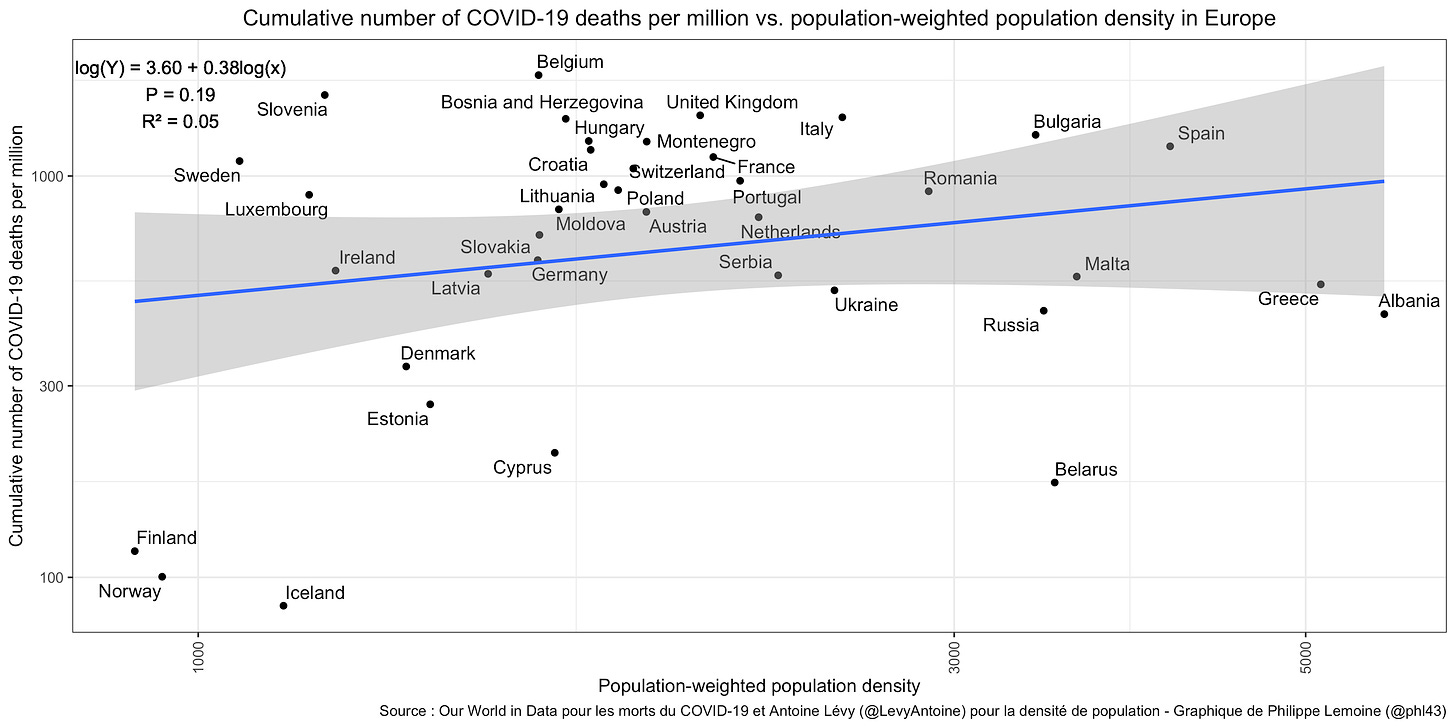
Why did Scandinavia as a whole do so well? An easy guess would be low population density, but Philippe Lemoine finds there was no overall correlation in Europe between population-weighted population density and COVID death rate:
I also checked if Human Development Index explained anything; it didn’t. A more plausible explanation is household size - Scandinavia is remarkable for having more one-person and single-family households, and fewer multi-generational clans living together.
 The maximally trollish explanation: Vitamin D causes coronavirus, so only the sunless north is safe.
But it’s also worth mentioning that US states that seemed kind of like Scandinavia (northern, forested, liberal) also had the lowest number of coronavirus cases in the continental US - #1 through #5 were Vermont, Oregon, Maine, Washington, and New Hampshire. And this isn’t clearly related to household size, so maybe something else is going on.
Anyway, a reasonable conclusion might be that Sweden had between 2x (if we compare it to an average European country) and 6x (if we compare it to an average Scandinavian country) the expected death rate in the first phase of the pandemic.
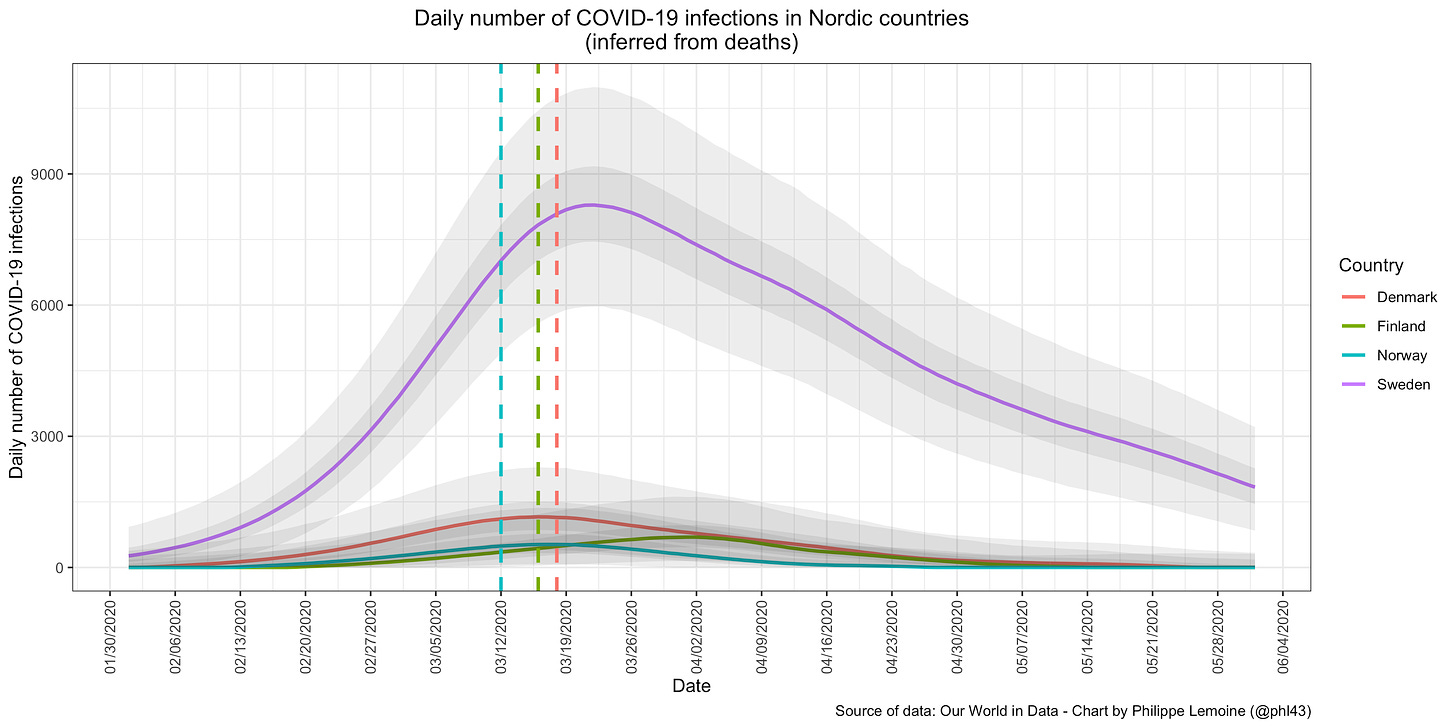
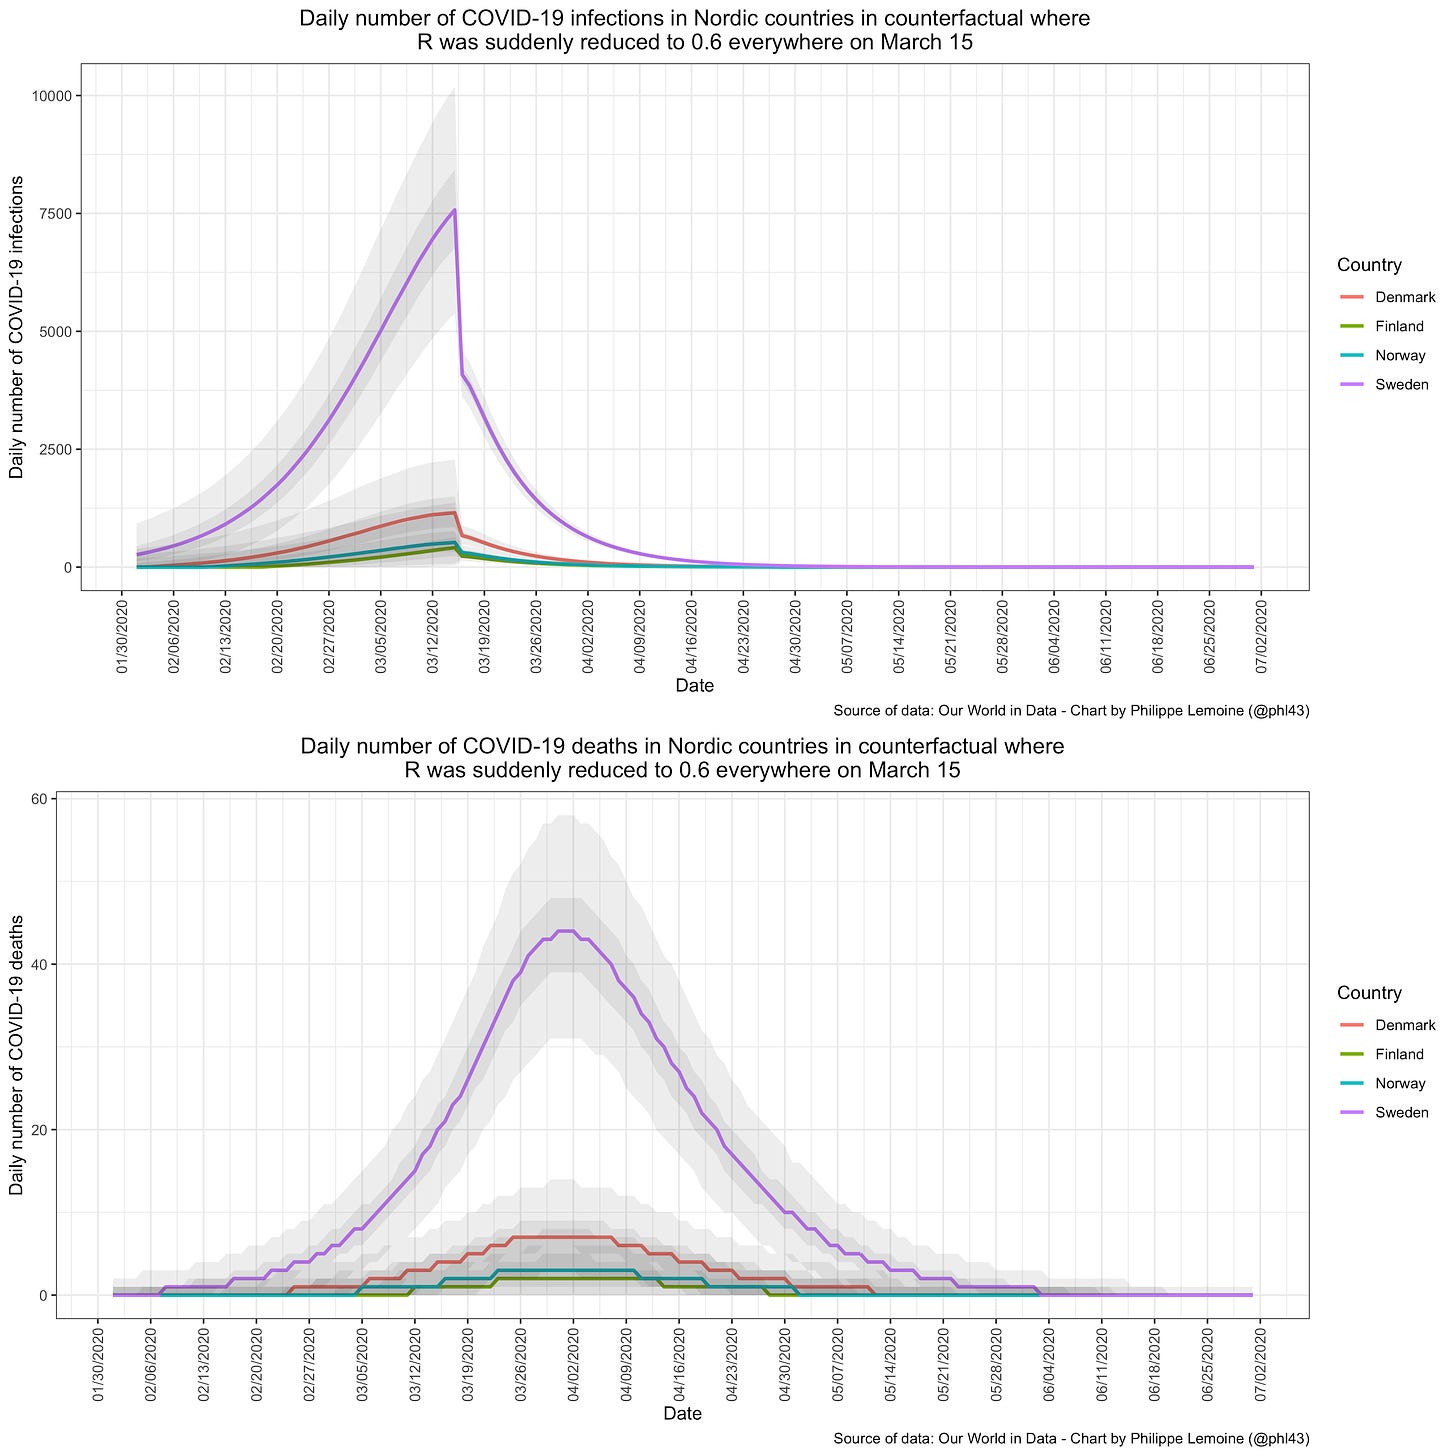
Philippe Lemoine is extremely against this conclusion. He first argues that since we don’t know why Finland+Iceland+Norway+Denmark did so well, we can’t assume it’s a “Scandinavia effect” and so we can’t assume Sweden would share it. Therefore, we should be judging it against the European average rather than the (better) Scandinavian average. I would counter that, although we can’t prove that just because X is true of Finland+Iceland+Norway+Denmark and not other European countries, that it should also be true of Sweden, but we should have a pretty high prior on it, in the same way that eg if we know that X was true in every American state except Arkansas (whose value was unknown), and not in any non-American polities, we should have a high prior that X is true in Arkansas. Anyway, even if we don’t compare Sweden the rest of Scandinavia, we would compare it to Europe, which it did twice as bad as.
His second argument is that the epidemic started earlier in Sweden, and therefore had more time to progress before the mid-March period when everyone started panicking and taking various actions. Countries where the epidemic started earlier naturally did worse, so it’s unfair to judge Sweden by the standards of other countries where it started later.
The graphs above don’t look like the epidemic started earlier in Sweden, but this could be because tests missed some of the early cases. Lemoine somewhat convincingly argues that there were more deaths early on in Sweden, which suggests that - observed or not - the epidemic started earlier there.
And that given how early the epidemic started in Sweden, we should expect more deaths before it got under control:
I’m not math-y enough to judge Lemoine’s simulations, so instead I decided to judge Sweden against other European countries where the epidemic started at the same time or earlier - that is, ones that had more deaths per capita than Sweden as of March 21 2020.
Here Sweden is in the middle of the pack. But looking at the graph, it’s really striking how every other country “flattens the curve” by about May 1, but Swedes just keep dying. My reading of this graph is that, since we selected for countries doing worse than Sweden as of March 21, we start out with Sweden doing the best, but other countries are able to control their epidemics much faster than Sweden is, and by August Sweden has fallen to around the middle. Contra Lemoine’s picture where Sweden just has an earlier start but eventually does no worse than everywhere else, here Sweden has the same (or better) start as everyone else, but clearly does worse afterwards.
What about in later phases of the pandemic? Here it gets complicated. Until about New Years’, Sweden’s lockdown was less strict than average for Europe, but stricter than for the rest of Scandinavia - presumably the rest of Scandinavia did so well that they relaxed a lot, even more than Sweden did. In the winter, when the second wave started, Sweden tightened some of its restrictions, until the stringency index says they matched the European average (though Europeans I’ve talked to disagree and say Sweden still felt much less strict than elsewhere). Then it had a pretty average-sized second wave (as did Denmark). But unlike other Scandinavian countries (though like France and Germany), Sweden had a severe third wave. Can we attribute this to a looser lockdown? I am nervous about doing this, since the stringency index says its lockdown strictness was average during this period, which is why I’m going to mostly be relying on the first-wave data.
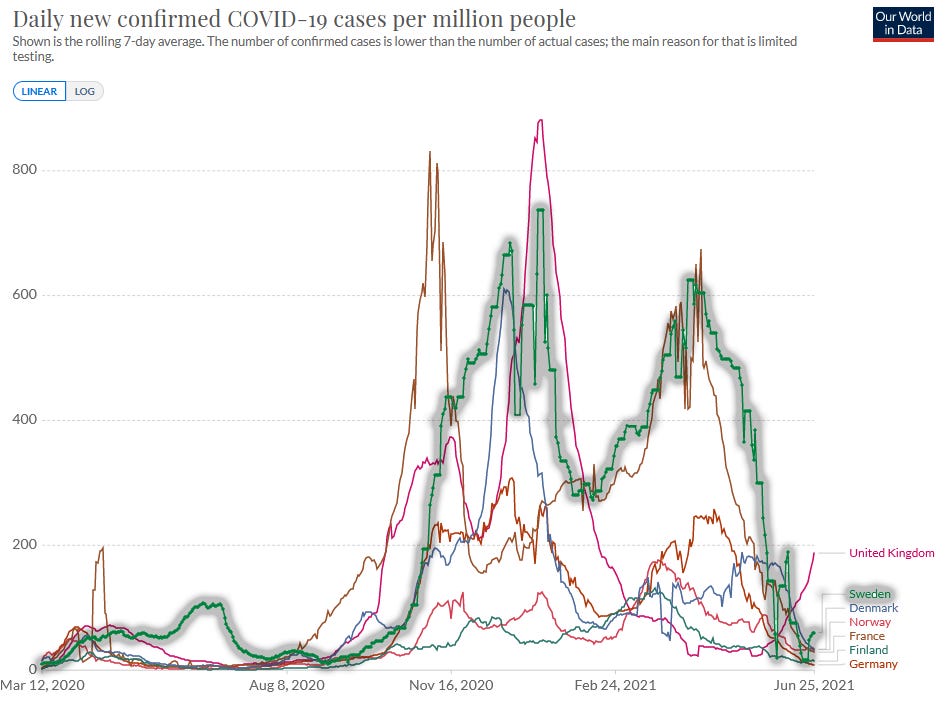 All of this gets really confusing and I think everyone on all sides of this debate should agree to just never mention Sweden again. Not just with respect to coronavirus policy. At all. If anyone asks, there are only two Scandinavian countries, Ikea comes from Denmark, and ABBA was just a weird dream.
In conclusion, the weaker Swedish lockdown in the early phase of the pandemic probably increased the death rate by a factor of two (using other European countries as a counterfactual/control) to five (using other Scandinavian countries as a counterfactual/control). These people investigate this question more formally and find something similar. These changes in death rate mean the policy caused an extra 1,000 to 3,000 deaths in the early phase of the pandemic. There was probably less effect in the later phases of the pandemic because Sweden’s lockdown policy was closer to everyone else’s.
Actual Evidence 3: Overly Simple Models Of US States During Later Phases Of The Pandemic
America is the greatest country in the world, at least as far as coronavirus lockdown data are concerned. Its advantages over Europe are many: first, there are 50 states, rather than the 20-something European countries most researchers studied. Second, those states have fewer confounding cultural differences. Third, European countries were pretty practical about what amount of lockdown they had at any given time, reacting to changes in the pandemic. US states mostly had stable and predictable responses based on their internal politics - a nice exogenous factor! The correlation between lockdown strictness in May vs. lockdown strictness in January among European countries was 0.2 (not statistically significant); in the US it was 0.5 and very significant. So instead of having to nitpick over which country instituted the same lockdown policy two days earlier than which other country, we can look at which states stably did vs. didn’t have strict lockdowns through the majority of the pandemic.
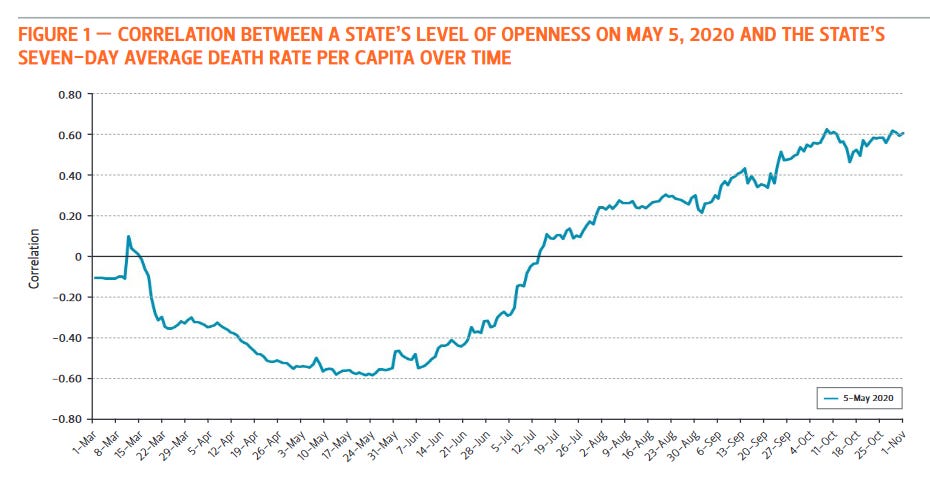 Source: https://www.bakerinstitute.org/media/files/files/fba2e32c/bi-report-121620-chb-covid19.pdf
This is an absolutely beautiful graph. It’s showing how lockdown strictness (as of May 5) correlates with death rate over time. We find that early in the epidemic, the stricter your lockdown, the worse you’re doing. This is the endogeneity - places (like NYC) that are doing really badly institute strict lockdowns to try to save themselves. Later in the epidemic, the stricter your lockdown, the better you’re doing - probably because the strict lockdown is giving good results.
Why May 5? No real reason. It turns out it doesn’t matter which time you measure lockdown, because US states are pretty stable in their rank order of lockdown strictness (eg California is always stricter than North Dakota):
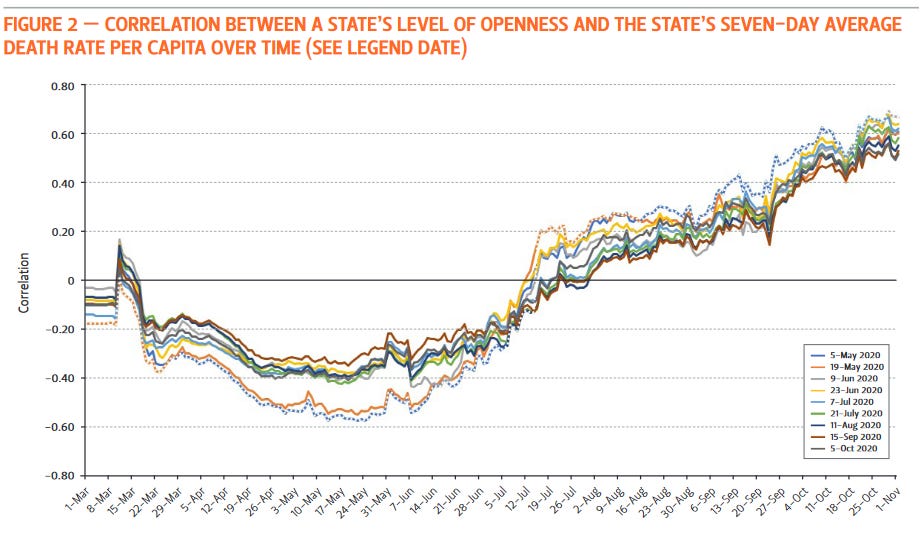 Each of these colored lines represents lockdown strictness measured at a different time, but they all tell the same story.
Are there other explanations? I wondered if states that did worse in the first wave might have done better in the second because most of their vulnerable residents had already been infected/killed. But I don’t think this is a big problem; most places had only about 5% of the population infected during the first wave, and even the worst states only about 10%. Another possibility: it could be that states which were harder-hit during the early pandemic both instituted stricter lockdowns, and also their residents were scared into more voluntary behavior changes. But it’s certainly consistent with lockdowns working. And even the possibility where it isn’t lockdowns suggest voluntary behavior changes work on the margin (eg changes which people didn’t make in less-hard-hit states, but did make in harder-hit states, were still valuable) which would suggest that forcing those behavior changes with lockdowns should also work.
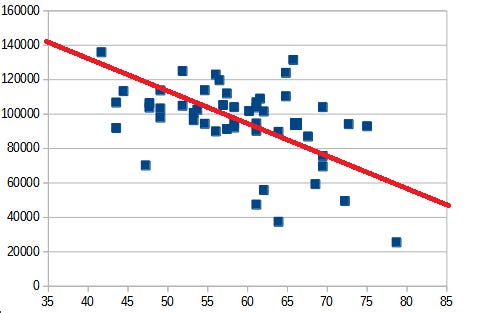
This graph ends on November 1, before the third wave got really bad. Does its conclusion still hold? I repeated its analysis using current case counts plotted against the stringency index for January 1 2021 (a nice round random day, to prove I’m not cherry-picking). Here’s what I got:
There was a significant negative correlation (-0.55) between the lockdown stringency index as of January 1, and the number of post-first-wave cases a state had. This was robust to different times for the stringency index, and for using all cases instead of just post-first-wave cases (although some of these changes slightly diminished the magnitude of the effect).
This is a victory for lockdowns insofar as the correlation is significant, but strong proponents might be surprised by how small the effect was. A few small isolated northern states like Vermont did very well. But most states - from California and New York to Florida and Texas - clustered in a band between 80,000 and 120,000 cases per million. States at the 75th percentile of lockdown strictness had about 17.5% fewer cases per million than states at the 25th percentile.
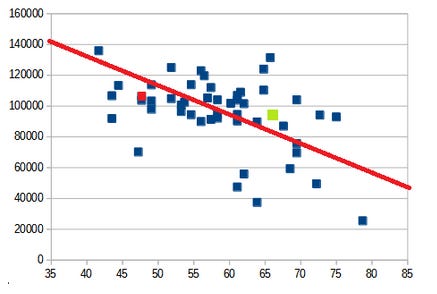 A lot has been written about how weird it is that California (with a strict lockdown) had an infection rate around 9.6%, and Florida (with a loose lockdown) had an only slightly higher rate of 10.8%. Here we see that California (marked in green) and Florida (marked in red) are slight outliers in their respective directions, but only very slight.
I made no effort to control for confounders here, but it’s also hard to see how they could be affecting these results too much. Stricter states did have more urban residents and minorities - two groups that got hit especially hard. But Florida and Georgia also have big cities and minority communities, and they fell pretty much in the middle of the weak-lockdown range. State-specific factors might shift this a few percent here and there, but aren’t going to be getting us to a conclusion where lockdowns halve the case count or anything.
Why didn’t lockdowns help more? Part of the answer must be that even weak-lockdown states had lots of voluntary behavior change, and even strong-lockdown states had lots of people ignore the lockdowns. But I think the main answer is that in every state, people panicked and tightened up when cases got bad, then relaxed and got careless once cases dropped again, making it hard for lockdowns to have too much effect - once a lockdown “succeeded”, it just made people go back to being careless.
Does it illuminate anything to plot this over time?
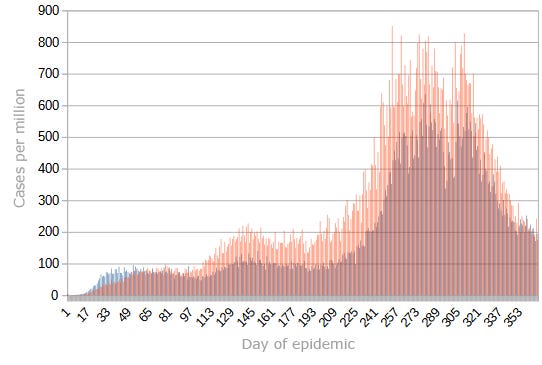
Red is weaker-lockdown states, blue is stronger-lockdown states. The strong-lockdown advantage is pretty consistent. If we can read anything from this, it’s that lockdowns have a bit more of an advantage when things are already pretty stable, and a bit less at dealing with sudden giant spikes. My data source didn’t have the past few months, but if someone does, let me know.
Actual Evidence 4: The Lockdown Economy
The benefits of lockdowns are measured in lives saved. The cost is measured in psychological suffering and economic decline. In order to do a cost-benefit analysis, we should figure out how much stricter lockdowns affected the economy.
Lockdown proponents note that under certain situations, lockdowns can improve the economy. Voluntary behavior change means that people won’t patronize businesses in the middle of a raging pandemic. So if lockdowns were really successful in limiting the pandemic, they might have indirect pro-economy effects that outweigh their direct anti-economy effects.
What about in Sweden?
Sweden’s economy did worse than Finland’s, the same as Denmark’s, and better than the EU average. Depending on which country you think is a natural control group, you could draw any conclusion you want from this.
What about US states?
Here is an incredibly dumb simple model that takes no account of timing and doesn’t adjust for any confounders:
This correlates the stringency index of a state in January 2021 with the GDP decrease in that state. Correlation is 0.3 and significant. You could argue Hawaii is an outlier - if you remove it (which I won’t), this would go down to 0.2 and not significant.
Suppose we call states in the top half of lockdown strictness “blue states” and those in the bottom half “red states” (this is almost, but not quite, literally correct). The average blue state has a GDP decrease of 3.94; the average red state of 3.34. Multiplying out, if the entire US had had a red state level of lockdown, it might have saved $64 billion. For context, the US’ entire COVID related loss, assuming GDP would otherwise have grown at the same rate as in 2019, was $1.2 trillion, so having all blue states go down to a red state level of lockdown would have saved about 5% of that.
This contradicts the conclusion of the report discussed here , which says that lockdown states did better than non-lockdown states economically. Unfortunately, the report doesn’t exist at the link in the article, and I can’t find it anywhere. Going by discussion of it, it seems to choose a subset of states to focus on, without giving a great explanation for why. Overall I am not too tempted to replace my extremely simplistic analysis with theirs, even if I could find it.
Pre-Conclusion 1: Trying To Reconcile European and US Estimates
The evidence from Sweden suggests that weak lockdowns could increase death rates by 100% or more. The evidence from the US only finds that they increase death rates by about 20%. Why the difference? Might it be because there’s more of a difference between Sweden and other European countries than between red and blue US states?
Nope, doesn’t look that way.
My unsupported guess is that lockdowns were more important in the first uncontrolled-growth phase of the pandemic. Maybe this is a purely mathematical fact - reducing R from 4 to 2 saves more deaths over a certain period of time than changing it from 0.9 to 0.45. It could also have to do with how “primed” populations were for voluntary behavior change. Since the Swedish data is mostly looking at the first phase of the pandemic, and the US data mostly at later phases, that would explain the extent of the difference.
Conclusion 1: Extremely Naive Attempt To Try To Quantify Economic Costs Vs. Benefits
Using the naive linear US model, we find that if all blue states had instead had an average red state level of lockdown, it would have cost 50,000 lives and saved $64 billion. Saving 50,000 lives for $64 billion is about $1.3 million per life.
This is much more than it costs to save people in the Third World with efficient charity (probably around $5,000 to $10,000 / life), but lower than the US government uses for various other purposes. For example, when the EPA is determining how worth-it environmental regulations are, they value one life at $9.1 million; when the Department of Transportation is determining how worth-it road safety regulations are, they value a life at $9.6 million. So this is pretty good by normal First World decision-making standards.
But we might be tempted to count lives saved from COVID less than we would usually count lives saved, since the people who died of COVID were generally older people with multiple comorbidities who might have died soon anyway. This paper finds that the average COVID victim might have lived another 8 QALYs (quality-adjusted life years - a measure of years of life saved, in which years when you are very sick and can’t do anything count as less than a full year) if they hadn’t gotten COVID.
What about nonfatal cases of COVID? Mild cases with no lasting side effects don’t contribute substantially. Suppose that the average case lasts two weeks, and completely ruins those two weeks - the hedonic value of your life during that time is zero. That’s one twenty-sixth of a quality-adjusted life-year. Since cases are 50-100x as common as deaths, plausibly this adds about 50% to our estimates.
What about long-term sequelae of COVID (ie “#LongCovid”)? The extent of these is poorly understood and debatable. This study says about a third of people have symptoms six months out, most mild but some severe. But this kind of situation seems tailor-made for reporting bias - everyone has some weird symptom or other all the time, and if you’ve just had COVID you’ll probably attribute it to that (cf. the debate around chronic Lyme disease).
I plugged some plausible estimates based on all this into a Guesstimate model and got a cost per QALY saved of between basically free (assuming that the correlation between stringency and GDP loss was an illusion and blue states did no worse than red ones) and $300,000 per QALY, with the median estimate at $98,000 per QALY. First World countries usually value QALYs at $50,000 to $150,000. Given the extreme uncertainty in all these estimates, I don’t feel comfortable saying that this was obviously good or obviously bad. It’s just kind of around the number where some people might think it was worth it and other people might not.
 Remember, this is the cost vs. benefits of going from an average blue state level of lockdown to an average red state level. Taking no measures at all would probably be much worse.
I don’t feel anywhere close to able to quantify the economic gain/loss in Sweden. But if we stick with our tentative previous conclusion that a counterfactual early Swedish lockdown would have been more effective at saving lives than late American ones, then QALYs might be cheaper in Sweden, approaching the point where almost everyone would say it was worth it.
Conclusion 2: Extremely Naive Attempt To Try To Quantify Emotional Costs Vs. Benefits
Consider again the question of whether Sweden should have implemented a more European-typical lockdown during the first wave of the pandemic.
(remember again that “no interventions at all” isn’t on the table, just the slightly weaker Swedish lockdown vs. a slightly stricter Europe-typical lockdown)
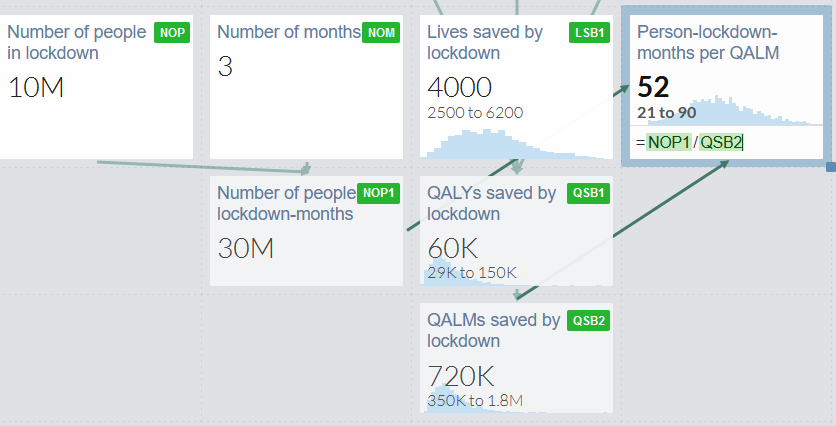
This would have made 10 million Swedes be under stricter lockdown for the three months of so of the first wave. By our calculations above, it might have saved about 2500 lives, but let’s be really generous and extend the confidence interval to 6,000 - ie it might have prevented every single case in Sweden. Here’s what the Guesstimate model says:
10 million people x 3 months = 30 million lockdown months. Between 2500 and 6000 lives saved, by our previous estimates each life is worth about 15 QALYs (by combination of deaths, associated nonfatal cases, and associated long COVID cases), and each QALY contains 12 months, for a total of 720,000 QALMs. So every 52 months of stricter lockdown in counterfactual Sweden would have saved one month of healthy life. You will have to decide whether you think this is worth it, but it seems pretty harsh to me.
Might this be because these numbers are off, and the lockdown would have saved more lives than the model allows? I don’t think that could change things very much. Remember, our confidence interval included the scenario where strict lockdown has 100% efficacy and prevents every single COVID case. Even if this is true, that just means it’s 21 months of stricter lockdown to save one month of healthy life. Again, seems pretty harsh.
How about in the US? Here’s the relevant model:
It should be pretty straightforward, except that I’ve set the number of months in lockdown to be an unknown variable between 3 and 9, since I’m not sure how many crucial months it would have taken to get red states down to the blue state average. As before, I’ve made the confidence intervals include the possibility that a stricter lockdown would have saved every single life in US red states, even though this is absurd (it only saved ~20% of lives in blue states).
Here, having US red states switch to a blue-state typical level of lockdown would save one month of healthy life per 51 person-months in stricter lockdown. Again, seems pretty harsh. Another way of looking at this is that each person who spent a month in slightly stricter lockdown would have saved someone else about 15 hours of healthy life.
Is there any counterargument to these somewhat pessimistic conclusions?
One possibility: even if we agree that almost all of the cost of COVID comes from the emotional burden of strict lockdowns, and not from death and disease, looser lockdowns now might mean stricter lockdowns later. Sweden started with a looser lockdown than Norway, but ended with a stricter one after Norway’s strong lockdown ended the first phase of the pandemic quickly and Sweden’s weak one didn’t.
And even if Sweden had decided to double down and weaken their lockdown despite high case levels, people would probably have voluntarily stayed home more because the pandemic was so bad - inflicting most of the same costs that a state-mandated lockdown would.
This argument seems less convincing in the US, where red states mostly just consistently had weaker lockdowns than blue states did, and never really got stricter to compensate.
 Source: here
Conclusion 3: Complicated Things I Am Not Accounting For
We couldn’t have known any of this at the beginning of the pandemic, and had to make choices from a position of uncertainty.
If we had let the virus spread more, it would have gotten more chances to mutate. The more infectious variants we’re seeing now would have appeared earlier, and vaccines might have been less effective.
If we had let the virus spread until we reached herd immunity (implausible, would have required no voluntary behavior change), we wouldn’t have bothered creating vaccines, and vaccines are going to be really important for the Third World which has very different tradeoffs.
If we had done lockdowns differently, it might have unpredictably caused different levels in voluntary behavior change. Or it might have caused people to lose trust in government in ways that would be bad (or possibly good?) later on.
If there had been looser lockdowns, more children would have had to go to school, which would have been either good or bad depending on how you feel about school.
People dying or getting sick is bad not just for those people, but for their friends and loved ones, and the companies and institutions that depend on them.
Usually economic costs measured in QALYs are used to represent government expenditure, but in this model they’re representing costs incurred by real people, some of whom are poor and a lot worse off when they lose money than the government is. Technically, you could think of a $64 billion economic loss as “Jeff Bezos pays half his fortune, everyone else is fine”, or as “one million middle class people who usually make $64,000/year now make zero for one year”, and these have very different utilitarian costs, and the usual way of thinking of economic costs probably underestimates them in this case.
Economic costs of COVID aren’t just a one-time dollar loss, but also involve businesses closing (which might not reopen), institutional knowledge getting lost (which might be hard to regain), people losing jobs (who might have trouble getting a new job), etc. They could also represent a form of “creative destruction” that does unpredictable things to the industrial landscape.
I am assuming that vaccines will mostly work and the pandemic will gradually get better from here. If new variants emerge that are genuinely vaccine-resistant, and the whole process starts over again, that could change the calculations - though I’m not sure in what direction.
Maybe this was a dress rehearsal for a much worse pandemic later on, and the most important effect of our choices now will be setting the defaults and expectations for how we respond to that one.
Conclusion 4: Summary
1: Various policies lumped together as “lockdowns” probably significantly decreased R. Full-blown stay-at home orders were less important than targeted policies like school closures and banning large gatherings. Talking about which ones were “good” or “bad” is an oversimplification compared to the more useful questions of when countries should have started vs. stopped each to be on some kind of Pareto frontier of lives saved vs. cost.
2: If Sweden had a stronger lockdown more like those of other European countries, it probably could have reduced its death rate by 50-80%, saving 2,500+ lives.
3: On a very naive comparison, US states with stricter lockdowns had about 20% lower death rates than states with weaker ones, and about 0.6% more GDP decline. There are high error bars on both those estimates.
4: Judging lockdowns by traditional measures of economic significance, moving from a US red-state level of lockdown to a US blue-state level of lockdown is in the range normally associated with interventions that are debatably cost-effective/utility-positive, with error bars including “obviously good” and “pretty bad”. It’s harder to estimate for Sweden, but plausibly for them to move to a more European-typical level of lockdown in the early phase of the pandemic would have very much cleared the bar and been unambiguously cost effective/utility-positive.
5: It’s harder to justify strict lockdowns in terms of the non-economic suffering produced. Even assumptions skewed to be maximally pro-strict-lockdown, eg where strict lockdowns would have prevented every single coronavirus case, suggest that it would have taken dozens of months of somewhat stricter lockdown to save one month of healthy life. This might still be justifiable if present strict lockdowns now prevented future strict lockdowns (mandated or voluntary), which might be true in Europe but doesn’t seem as true in the US.
6: Plausibly, really fast and well-targeted lockdowns could have been better along every dimension than either strong-lockdown areas’ strong lockdowns or weak-lockdown areas’ weak lockdowns. We should celebrate the countries that successfully pulled this off, and support the people trying to figure out how to make this easier to pull off next time.
7: All of this is very speculative and affected by a lot of factors, and the error bars are very wide.
Many people helped me navigate through these issues. Thanks to subscribers for reviewing an early draft of this post, to Philippe Lemoine (whoblogs here at CSPI) for helping me understand the case against lockdowns, and to a researcher who prefers to remain anonymous, for helping me understand the case for (well-targeted) lockdowns.

